
Figure 2.
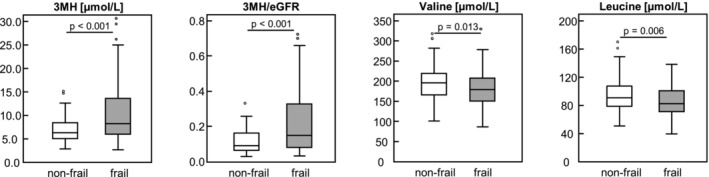
Circulating 3MH‐related biomarker and BCAA concentrations by frailty status among 220 patients. Data are shown as boxplot; differences between frailty groups were determined by Student's t‐test for normally distributed data or by Mann–Whitney U test for non‐normally distributed data; statistically significant different at P < 0.05. 3MH, 3‐methylhistidine; BCAA, branched‐chain amino acids; eGFR, estimated glomerular filtration rate.