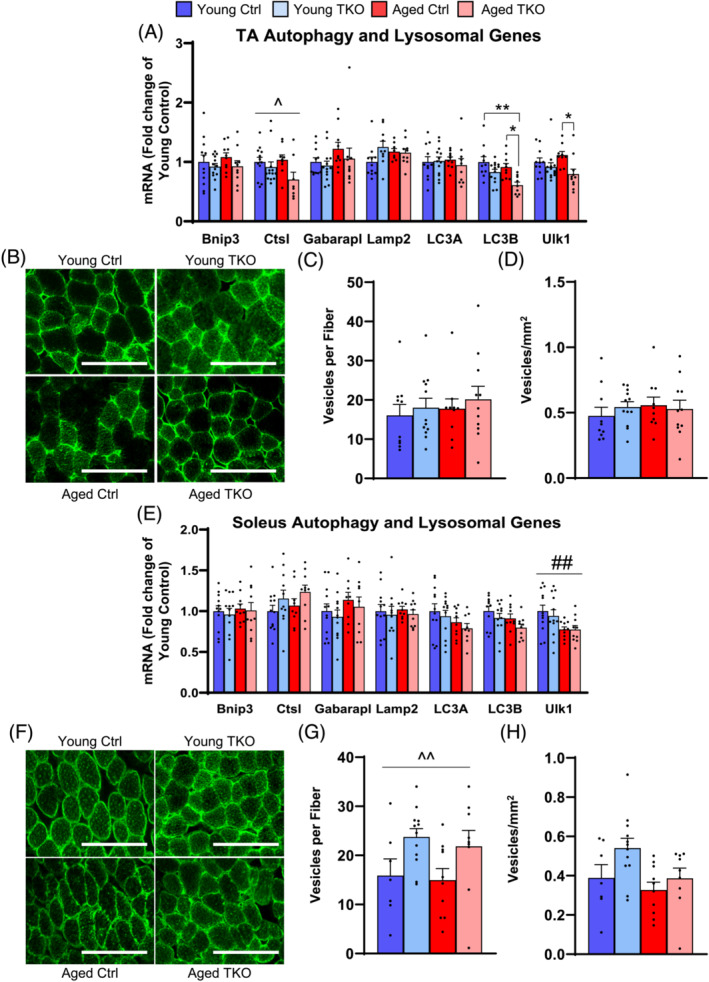
Figure 4.

Autophagy‐lysosome genes are minimally decreased and LC3A vesicles do not accumulate in TA or soleus from Young and Aged TKO. Quantitative RT‐PCR of autophagy lysosomal genes in TA (A) and soleus (E) muscle from Young Ctrl, Young TKO, Aged Ctrl, and Aged TKO (n = 9–13 per group). TBP was used as a housekeeping normalizer. LC3A stained cross section of TA (B) and soleus muscle (F) (scale bar 200 μm). Quantification of vesicles per fibre in TA (C) and soleus (G). Quantification of vesicle per mm2 in TA (D) and soleus (H) (n = 10–11 per group). *P < 0.05, **P < 0.01 as indicated, ^P < 0.05, ^^P < 0.01 genotype main effect, ##P < 0.01 age main effect by 2‐way ANOVA.
