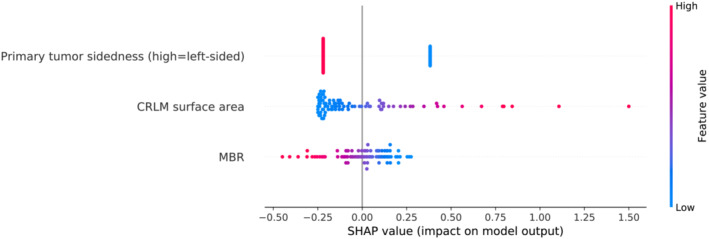
Figure 4.

Decision‐making of the prediction model based on SHAP. The parameters are ranked from top to bottom by their responsibility on the model output. Feature values are represented by the colour gradient. Higher SHAP values indicate the responsibility of parameters for higher predicted survival risk.
