
Figure 2.
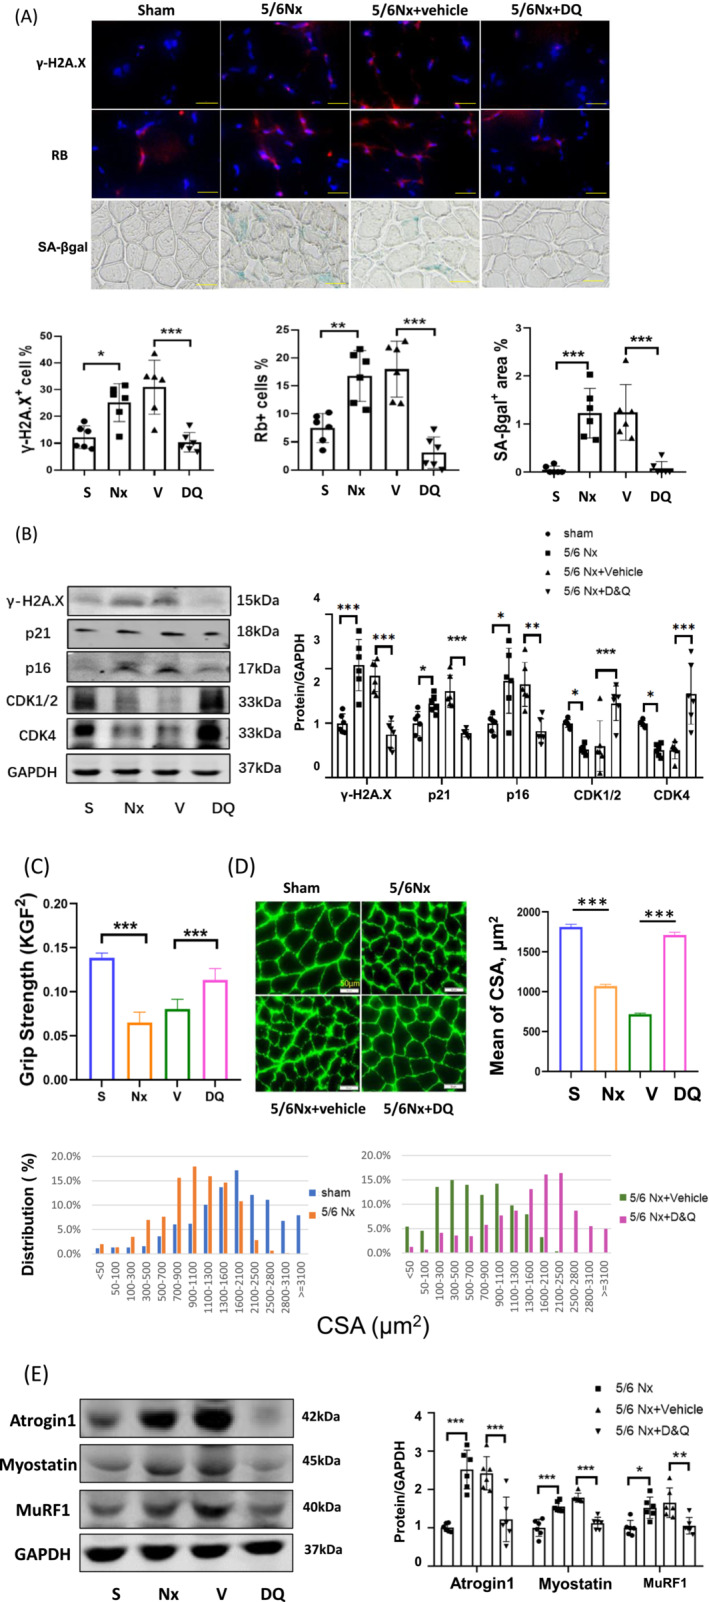
Limiting senescence with the senolytics ameliorated muscle wasting in CKD mice. CKD mice were fed a cocktail of dasatinib and quercetin (D&Q) two times per week and skeletal muscles were harvested 8 weeks later. (A) γ‐H2A.X+, Rb+, and SA‐β‐gal+ were stained in gastrocnemius (scale bar 50 μm). The positive cells were counted using ImageJ software. The results are reported in the bar/point graphs as the percentage positive cells or area for sham (S), CKD (Nx) CKD plus vehicle (V), and CKD plus D&Q (DQ) (n = 6/group; mean ± SE; *P < 0.05; **P < 0.01; ***P < 0.001). (B) The protein level of senescence markers, γ‐H2A.X, p21, 16INK4a, cyclin‐dependent kinases (CDK)1/2, and CDK4 were measured by immunoblot analysis. The graphs show the normalized fold changes of the indicated proteins compared with the levels of sham group (presented as one‐fold) (n = 6/group; mean ± SE; *P < 0.05; **P < 0.01; ***P < 0.001). (C) Muscle function was measured using a mouse grip strength meter with dual computerized sensors to detect and record the grip force in each group of mice. Data are presented as mean ± SE (n = 6/group; KGF = kilogram force, ***P < 0.001). (D) Representative images of muscle cross‐sections immunostained with anti‐laminin antibody are presented. Cross‐sectional areas of 700–900 fibres per cohort were measured and the frequency distribution of fibre CSA are reported in the bar graph: Sham (blue), 5/6Nx (red), 5/6Nx + vehicle (green), and 5/6Nx + D&Q (purple) (mean ± SE; n = 6/group; scale bars = 50 μm). (E) The muscle atrophy markers atrogin‐1, MuRF1, and myostatin in the gastrocnemius muscle were measured by immunoblot analysis and normalized data are reported in arbitrary units in the bar/point graph (n = 6/group; mean ± SE; *P < 0.05; **P < 0.01; ***P < 0.001).