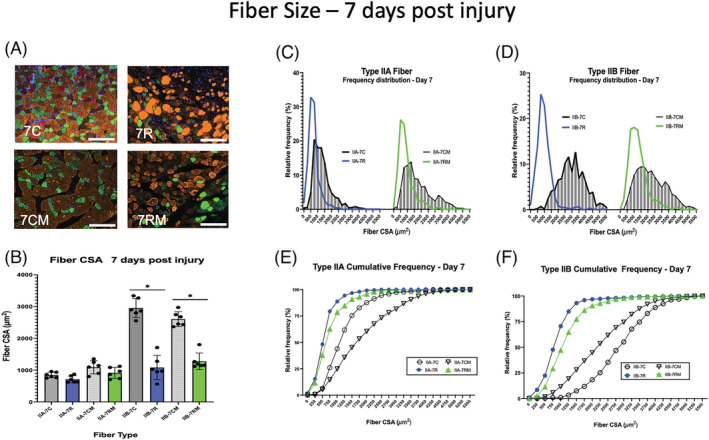
Figure 4.

Muscle fibre size 7 days after BaCl2 injury. (A) Examples of gastrocnemius cross sections of uninjured control muscles of phosphate‐buffered saline (PBS)‐injected mice (7C) or mitochondrial transplant therapy (MTT)‐treated mice (7CM). Examples of muscle cross sections are shown that were injured and allowed to repair for 7 days after systemic PBS treatment (7R) and systemic MTT treatment (7RM). Fibre type was identified by immunocytochemistry of myosin heavy chains. Type IIA fibres (green), Type IIB fibres (orange/gold), Type IIX fibres (black) and Type I fibres (red). The white bar is 200 μm in length. (B) Mean fibre cross‐sectional area (CSA) was obtained by planimetry from a minimum of 200 Type IIA and 200 Type IIB fibres in control non‐injured muscles and 200 Type IIA and 200 Type IIB fibres in repairing muscles 7 days after the BaCl2 injury. The data are presented as mean ± SD for each animal. Control non‐injured (PBS‐injected) muscles from PBS‐treated (7C) or MTT‐treated mice (7CM). Injured (BaCl2 injected) muscles from PBS sham‐treated (7R) or MTT‐treated mice (7RM). *Type IIB fibre CSA for 7C and 7CM were significantly greater than either 7R or 7RM Type IIB fibres at P < 0.05. (C–F) Fibre frequency histograms (C, D) and cumulative frequency distributions (E, F) for Type IIA (C, E) and Type IIB (D, F) fibres. (C, D) the corresponding control muscle data for the frequency histograms (7C or 7CM) are represented by shaded bars. The blue line represents data from PBS‐injected mice 7 days post‐injury (7R). The green line represents data from MTT‐injected mice after 7 days of injury (7RM). (E,F) Cumulative frequency distribution for control muscle data (7C, circle or 7CM, inverted triangle). The blue line, PBS‐injected mice 7 days post‐injury (7R). The green line, MTT‐injected mice after 7 days of injury (7RM).
