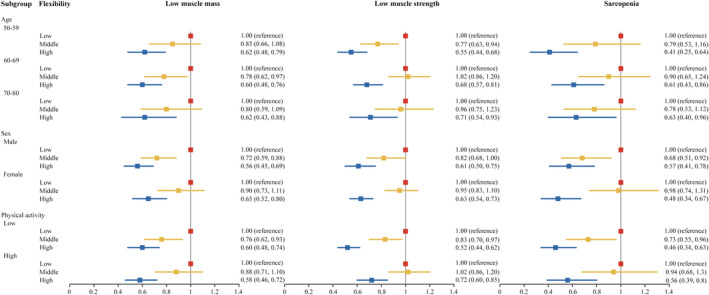
Figure 3.

Subgroup analyses of the cross‐sectional associations of flexibility with low muscle mass, low muscle strength and sarcopenia (n = 9453). Adjusted for age groups, sex, residential area, fat mass index categories, education levels, physical activity, drinking status, smoking status, diabetes, hypertension, hypertriglyceridaemia and low high‐density lipoprotein. Continuous age was included as a covariate in the regression models when stratified analyses by age group were performed.
