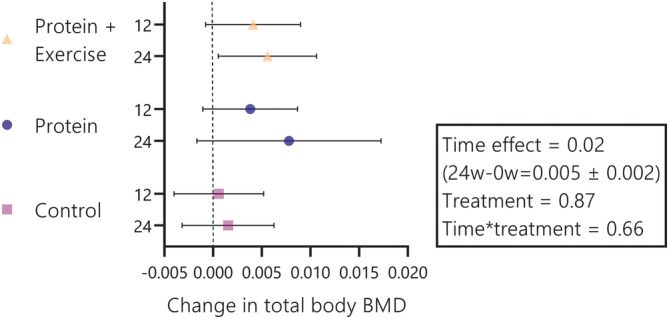
Figure 1.

Change in total body bone mineral density (BMD) per treatment group and per time (after 12 and 24 weeks). Wicked bars represent 95% confidence intervals. The wide confidence interval at the 24‐week time point in the protein group is a consequence of lower sample size due to the 12‐week duration of the ProMO‐trial. The 24‐week change in total body BMD after protein and exercise lost significance after Bonferroni correction. For protein + exercise, protein and control, sample sizes were n = 112, n = 113 and n = 115 at week 12 and n = 111, n = 31 and n = 115 at week 24, respectively.
