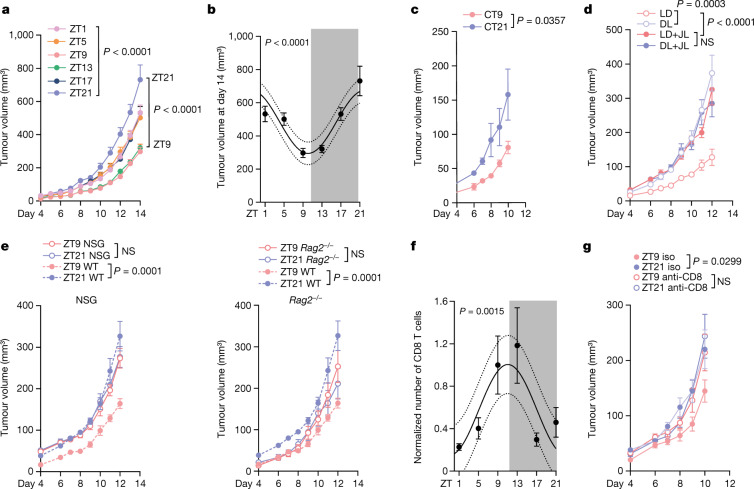
Fig. 1. The time of day of engraftment determines tumour size.
a, Tumour volume after engraftment of B16-F10-OVA cells at six different times of day. n = 10 mice from 2 independent experiments. Statistical analysis was performed using two-way analysis of variance (ANOVA). b, The tumour volume on day 14 from the experiments shown in a. Statistical analysis was performed using a cosinor analysis. c, Tumour volume after engraftment of B16-F10-OVA cells at two different times of day under constant darkness (DD) conditions. CT, circadian time. n = 6 mice from 2 independent experiments. Statistical analysis was performed using two-way ANOVA. d, Tumour volume after engraftment of B16-F10-OVA cells at two different times of day under light–dark (LD, n = 6 mice), inverted dark–light (DL, n = 7 mice) or jet lag (JL, n = 7 mice) conditions. For the jet lag condition, mice were placed into a 6 h or 12 h phase-delayed environment every 3 days. n = 2 independent experiments. Statistical analysis was performed using two-way ANOVA. e, Tumour volume after engraftment of B16-F10-OVA cells at two different times of day in NSG mice (left, n = 10 mice) or Rag2−/− mice (right). n = 10 (ZT9) and n = 11 (ZT21) mice. Control WT mice (n = 9) are plotted as a reference. Data are from two independent experiments. Statistical analysis was performed using two-way ANOVA. f, Tumour-infiltrating CD8+ T cells on day 14 from the experiment in a. From ZT1 to ZT21, n = 10, n = 9, n = 10, n = 7, n = 10, n = 8 mice from n = 4 independent experiments. Statistical analysis was performed using a cosinor analysis. g, Tumour volume after engraftment of B16-F10-OVA cells at two different times of day after anti-CD8 antibody depletion. Iso, isotype control. n = 6 mice from 2 independent experiments. Statistical analysis was performed using two-way ANOVA. The shaded areas indicate dark phases. For a–g, data are mean ± s.e.m. NS, not significant.

