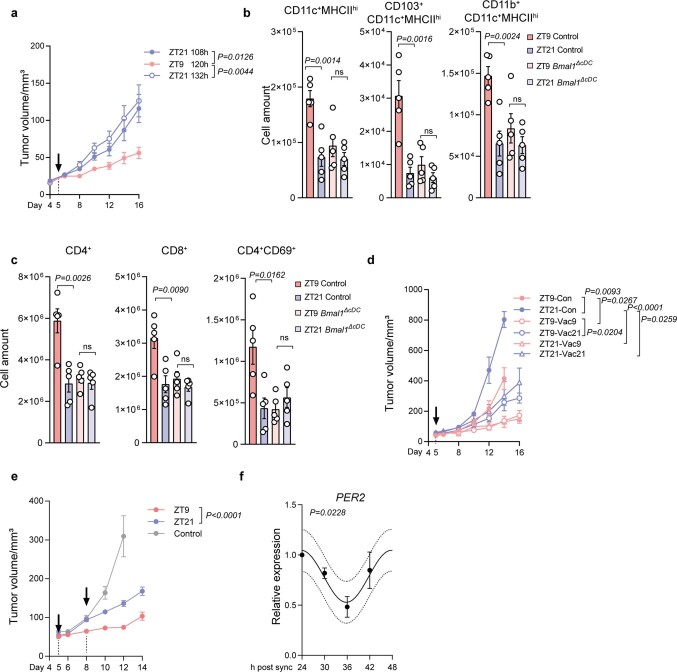
Extended Data Fig. 10. Time-of-day differences in vaccination efficacy.
(a) Tumour volume after B16-F10-OVA cell engraftment at ZT9 and OVA vaccination at ZT9 (120 h after tumour engraftment, n = 11) or ZT21 (108 h, n = 12, or 132 h, n = 11 mice, after tumour engraftment); from 2 independent experiments, two-way ANOVA. (b-c) Numbers of DC subsets (b) and T cells (c) in the draining LN 24h after OVA vaccination (on day 5 after B16-F10-OVA cell engraftment) in control or Clec9acre:Bmal1flox mice, n = 5 mice from 2 independent experiments, unpaired Student’s t-test. (d) Tumour volume in WT mice after tumour engraftment (5×10⁵ B16-F10-OVA cells) at ZT9 or ZT21, with or without OVA vaccination on day 5 (arrow) at ZT9 or ZT21, n = 4 mice, two-way ANOVA. (e) Tumour volume after B16-F10-OVA cell engraftment at ZT9 and OVA vaccination on day 5 and 8 (arrows), both at ZT9 or ZT21 (n = 6 mice) or unvaccinated controls (n = 9 mice), from 2 independent experiments, two-way ANOVA. (f) qPCR of human PER2 expression in human monocyte derived DCs (hMoDC) after synchronization, n = 3 patients, Cosinor analysis. All data are represented as mean ± SEM, ns, not significant, all t-tests are two-tailed.

