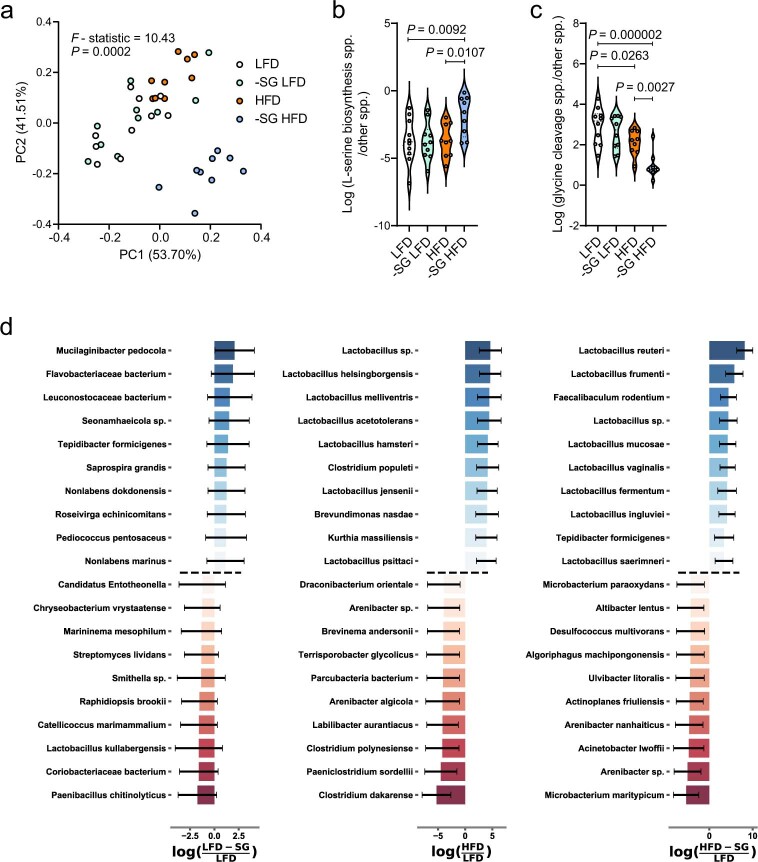
Extended Data Fig. 4. The impact of dietary serine restriction on microbiome composition.
(a) Robust principal-component analysis of microbiome beta-diversity 18 weeks after feeding mice with a low fat diet (LFD, n = 10), serine/glycine-free LFD (-SG LFD, n = 10), high fat diet (HFD, n = 9), and serine/glycine-free HFD (-SG HFD, n = 9). (b) Log-ratio of species with complete vs. incomplete pathways for L-serine biosynthesis 18 weeks after feeding mice with a low fat diet (LFD, n = 10), serine/glycine-free LFD (-SG LFD, n = 10), high fat diet (HFD, n = 9), and serine/glycine-free HFD (-SG HFD, n = 9). (c) Log-ratio of species with complete vs. incomplete pathways for glycine cleavage 18 weeks after feeding mice with a low fat diet (LFD, n = 10), serine/glycine-free LFD (-SG LFD, n = 10), high fat diet (HFD, n = 9), and serine/glycine-free HFD (-SG HFD, n = 9). (d) Log fold-change of microbiome species 18 weeks after feeding mice with a low fat diet (LFD, n = 10), serine/glycine-free LFD (-SG LFD, n = 10), high fat diet (HFD, n = 9), and serine/glycine-free HFD (-SG HFD, n = 9). Data are presented as a minimum/maximum (b–c) and were analyzed using a PERMANOVA test (a) and a two-way ANOVA with Fisher’s LSD post hoc test (b–c).

