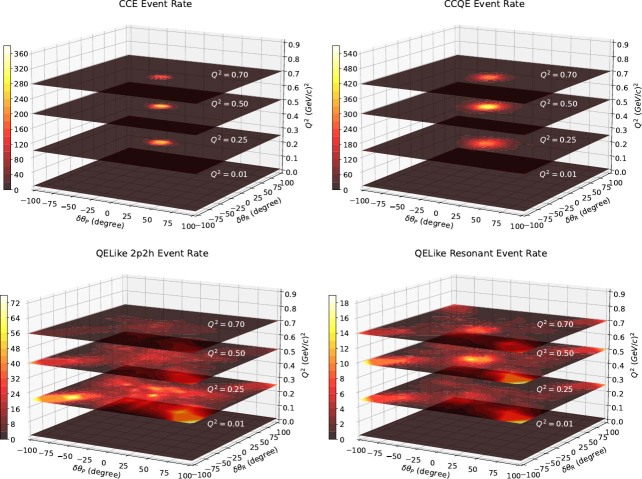
Extended Data Fig. 3. Simulated event rate in δθP − δθR plane in selected Q2 analysis bins.
Heat map showing Monte Carlo event rate for CCE, CCQE, QELike 2p2h, and QELike Resonant interaction models in the δθR-δθP plane at a few slices of Q2. CCE events are concentrated around origin, while the CCQE events have broader spread. Both QELike 2p2h and resonant events show diffused structure going out to larger δθR and δθP regions. The color scales in the heat maps are different because of different event rates for each subsample.

