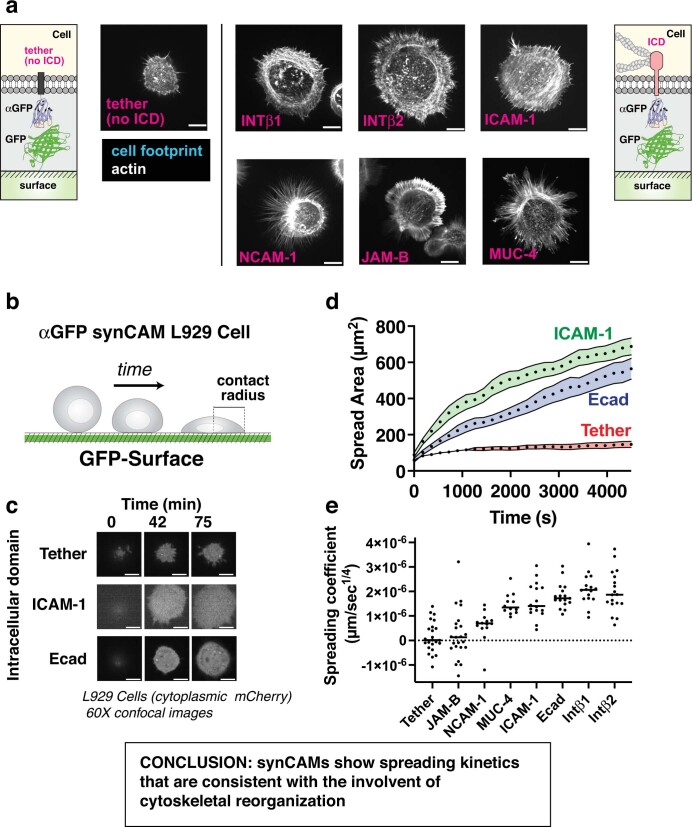
Extended Data Fig. 5. Cell spreading with alternative synCAMs (linked to Fig. 2).
(a) Example microscopy images of cell spreading assays from Fig. 2, showing phenotypes for all synCAM species (Scale bar = 10 µm). Representative images are shown of independent replicates from Tether n = 10, ICAM-1 n = 20, JAM-B n = 20, MUC-4 n = 15, NCAM-1 n = 20, Intβ1 n = 20, Intβ2 n = 20. SynCAMs are expressed in L929 fibroblasts and plated on a GFP coated glass surface. Cell footprint detected by membrane dye is indicated in blue outline; actin as stained by Phalloidin and shown in white. (b) Cartoon depicting the cell-spreading assay. L929 cells expressing an αGFP synCAM are plated on a GFP-coated surface and monitored over time. (c) Represented images from cell spreading assay of L929 cells expressing the indicated synCAMs. Individual slices from confocal images are shown. Scale bar = 10 µm. (d) Representative cell spreading contact area progress curves of L929 cells expressing the indicated synCAMs. Error = SEM. (e) Calculated spreading constants for L929 cells expressing the indicated synCAMs (where n is the number of unique cells analysed, Tether n = 24, Ecad n = 17, JAM-B n = 23, ICAM-1 n = 16, Intβ1 n = 16, Intβ2 n = 18, NCAM-1 n = 14, MUC-4 n = 12. Indicated line represents the median value).

