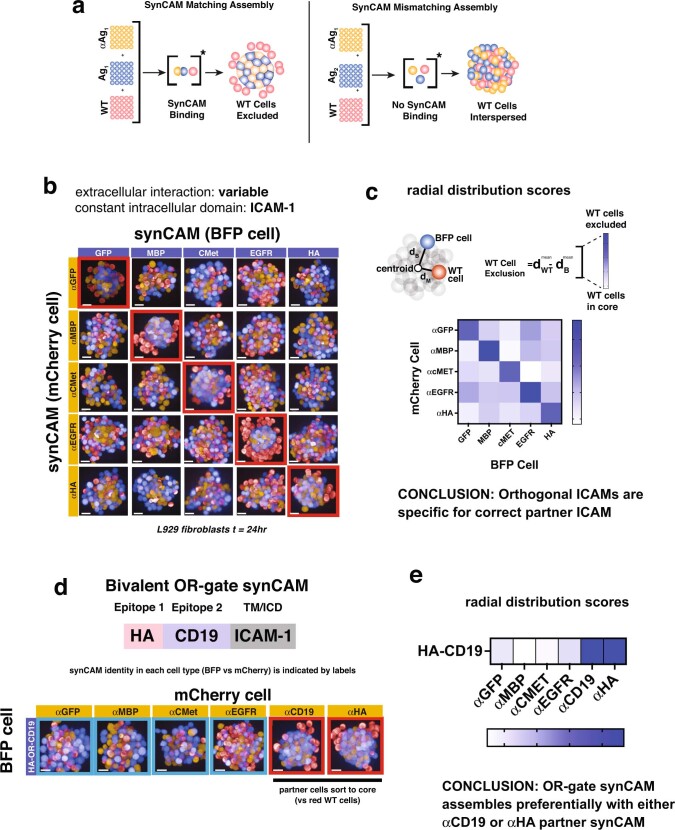
Extended Data Fig. 8. Testing orthogonality of synCAM ECD pairs by sorting assays (linked to main Fig. 4a).
(a) Cartoon depicting differential sorting assay used to determine orthogonality of synCAM ECD pairs. SynCAM pairs are mixed with parental L929 cells and imaged after 24 h. Sorting of parental cells should only occur if the cognate synCAM ECDs are correctly matched and able to bind. (b) Representative maximum projection images of differential sorting assay for a subset of the synCAMs with orthogonal ECDs (scale bar = 20 µm). Parental L929 cell sorting was only observed in the case of matching ECDs. (c) Quantification of sorting from b (n = 6). The difference of average distance from the centre of the sphere between parental L929 cells and BFP+ cells were calculated and are represented as a heat map. Exclusion of parental cells is observed in the case of matching synCAM pairs. (d) Representative maximum projection images synCAM design containing multiple epitopes within a single ECD (scale bar = 20 µm). The HA-CD19 ECD exhibits differential sorting for either αCD19 or αHA synCAMs only. Thus, we can generate OR-gate synCAMs capable of pairing with multiple adhesion partners. (e) Quantification of sorting from d (n = 6). The difference of average distance from the centre of the sphere between parental L929 cells and BFP+ cells were calculated and are represented as a heat map. Exclusion of parental cells is observed in the case of matching synCAM pairs.

