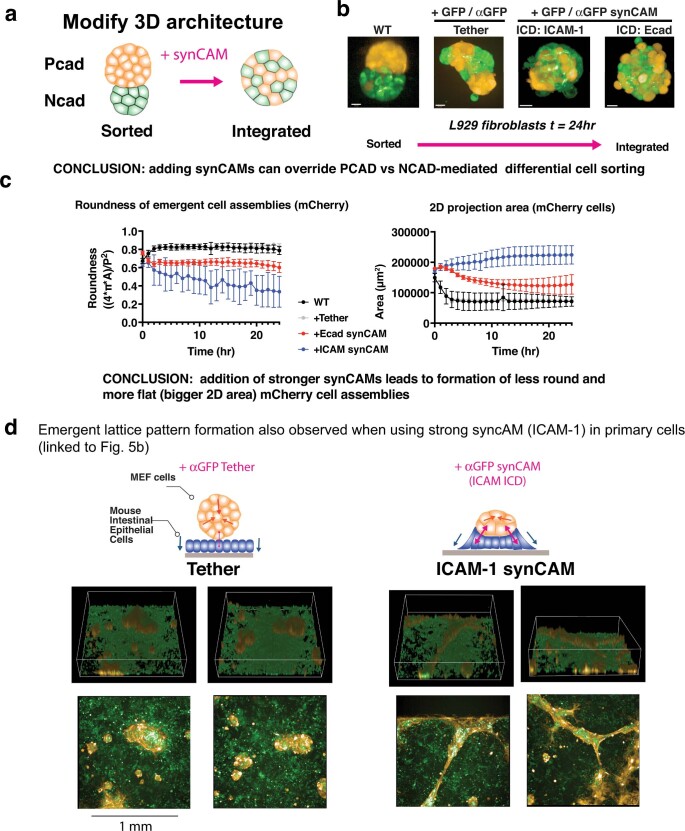
Extended Data Fig. 12. Control of Multicellular organization by synCAMs (linked to main Fig. 5).
(a) cartoon depicting modulation of WT Ncad (green) and WT Pcad (orange) sorting through introduction of synCAMs. (b) Maximum projections of 20X confocal microscopy images of WT Pcad and WT Ncad L929 cells with expression of the indicated heterophilic synCAMs (scale bar = 20 µm, t = 24 h). The GFP-synCAM is expressed in the Ncad-expressing L929 cell and αGFP synCAM in the Pcad-expressing L929 cell. Representative images are shown of three independent replicates. This data shows that synCAMs can drive integration between differentially sorting Pcad and Ncad cells, just as they can between Pcad and Ecad cells (Fig. 5a). (c) Quantification of roundness (left) and total surface area (right) of L929 cells from maximum projections of 20x confocal images in Fig. 5b (data are presented as mean values of n = 18 unique fields analysed across two independent wells, error = SD). (d) 3D (top) and maximum projection (bottom) views of multicellular assemblies between a mouse intestinal epithelial monolayer (green) and mouse embryonic fibroblast cells (MEFs) (orange) with either a GFP-αGFP tether (left) or synthetic ICAM-1 (right) heterophilic adhesion interaction. Representative images are shown of two independent replicates.

