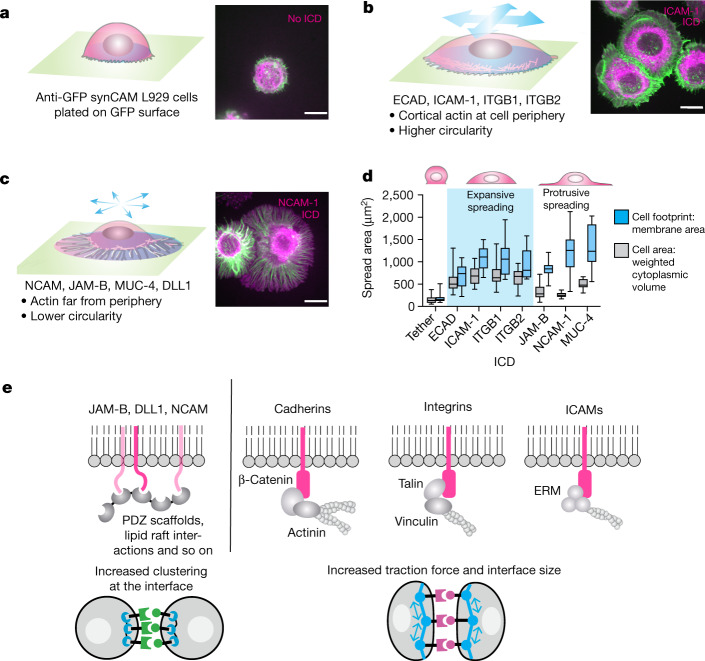
Fig. 2. SynCAM ICDs yield distinct mechanical and morphological properties.
a–c, Representative Phalloidin-stained images of L929 cells expressing the indicated synCAMs spreading on a GFP-coated surface. Scale bars, 10 µm. t = 2 h. Actin (Phalloidin stain) is shown in green; the full footprint of the cell (membrane label) is shown in purple. All of the images are shown at the same scale. a, The L929 cell expressing anti-GFP–tether (no ICD) shows minimal spreading. b, L929 cells expressing synCAMs with ICDs from ECAD, ICAM-1, ITGB1 and ITGB2 show an expansive spreading phenotype—the cell spreads in circular manner with cortical actin at the periphery of the cell footprint. See the spreading kinetic assays in Extended Data Fig. 5. c, L929 cells expressing synCAMs with ICDs from NCAM-1, JAM-B and MUC-4 show a protrusive spreading phenotype (a ‘fried egg’ shape)—cortical actin does not spread very far, but the cell membrane footprint extends in a very thin layer beyond the cell, often with less circularity (that is, more filopodial or lamellopodial in nature). d, The full footprint of the cell (blue) and cell area (grey) for synCAM-mediated cell spreading. For the box plots, the centre line shows the median, the box limits show the 25th to 75th percentile and the whiskers show the minimum to maximum values. Cell area: n = 23 (tether), n = 17 (ECAD), n = 23 (JAM-B), n = 16 (ICAM-1), n = 16 (ITGB1), n = 18 (ITGB2), n = 14 (NCAM-1), n = 12 (MUC-4). Cell footprint: n = 22 (tether), n = 21 (ECAD), n = 19 (JAM-B), n = 23 (ICAM-1), n = 16 (ITGB1), n = 12 (ITGB2), n = 14 (NCAM-1), n = 15 (MUC-4). e, Known recruitment interactions of downstream intracellular proteins found in CAM ICDs. See the mutational analysis of ICD-binding motifs in Extended Data Fig.6.

