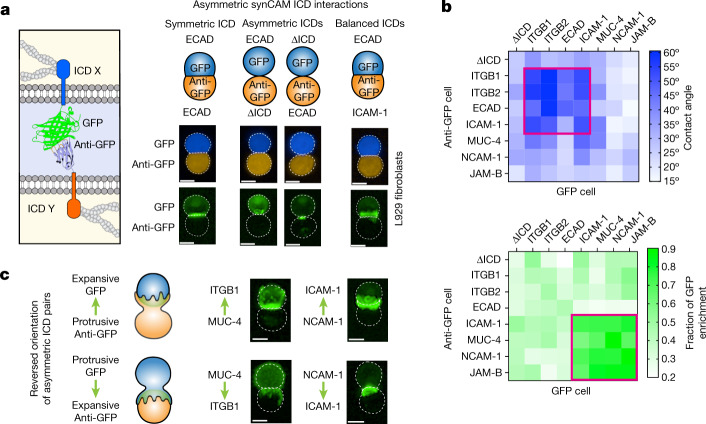
Fig. 3. The balance of ICD properties determines asymmetric synCAM interface morphology.
a, Maximum projection of ×20 confocal microscopy images of pairwise synCAM interfaces (t = 3 h), showing symmetric ECAD ICDs (left), asymmetric ECAD and tether (∆ICD) interfaces (middle), and balanced asymmetric ECAD and ICAM-1 interfaces (right). Scale bars, 10 µm. The mCherry and BFP channels (top) and the GFP channels (bottom) of representative images from ten pairs over three independent replicates are shown. b, Quantification of the contact angle (top) and GFP enrichment (bottom) for pairwise asymmetric synCAM interfaces. n = 10. The combination of interfaces that exhibit the greatest contact angle or enrichment are outlined in red. c, Example ×20 confocal microscopy images of pairwise unbalanced asymmetric interfaces in which a protrusive synCAM binds to an expansive synCAM. t = 3 h. Scale bars, 10 µm. Representative images from ten pairs over three independent replicates are shown. Top, binding between a protrusive anti-GFP synCAM and an expansive GFP synCAM. Bottom, binding between a protrusive GFP synCAM and an expansive anti-GFP synCAM.

