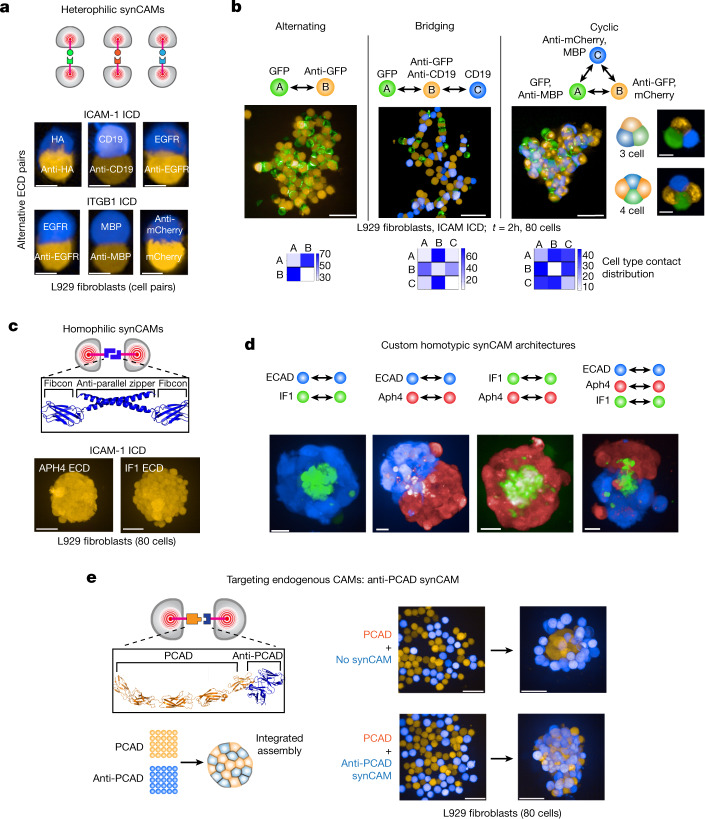
Fig. 4. Programming custom multicellular assemblies with homotypic and heterotypic synCAMs.
a, Heterophilic synCAMs with orthogonal extracellular recognition domains. Maximum projection of ×20 confocal microscopy cell–cell interface images are shown of L929 cells expressing synCAMs with the indicated antibody–antigen pair ECDs and either ICAM-1 (top) or ITGB1 (bottom) TM/ICD. Scale bars, 10 µm. t = 3 h. Representative images are shown of four independent replicates. Experimental testing of orthogonal sorting is shown in Extended Data Fig. 8. See Supplementary Video 1 for a time-lapse analysis of the orthogonal assembly formation. b, Engineering of custom heterotypic assemblies. Maximum projection of ×20 confocal microscopy images of L929 cells expressing synCAMs with the indicated ECD recognition partners. t = 2 h. Assemblies form alternating (left), bridging (middle) and cyclic (right) patterning. Example images of isolated cyclic interactions are shown. t = 2 h. A time-lapse analysis is shown in Supplementary Video 2. Probability boxes of cell contact distribution are shown below. n = 5. Scale bars, 50 µm (left 3 images) and 10 µm (insets). c, synCAM design with a homophilic-binding leucine zipper ECD (top). Bottom, maximum projection of ×20 confocal microscopy images of L929 cells expressing homophilic-binding synCAMs with the Aph4 or IF1 leucine-zipper ECD and ICAM-1 TM/ICD (ULA round-bottom well, 80 cells total). Scale bars, 50 µm. t = 24 h. Representative images are shown of three independent replicates. d, ×20 confocal microscopy images of differential sorting between L929 cells expressing WT ECAD or the indicated homophilic-binding synCAMs. Scale bars, 20 µm. t = 48 h. Representative images are shown with additional independent replicates in Extended Data Fig. 9. n = 15 (ECAD–IF1), n = 15 (ECAD–Aph4), n = 14 (IF1–Aph4) and n = 18 (ECAD–IF1–Aph4). e, Schematic of the receptor design and differential sorting assay of L929 cells expressing WT PCAD (orange) and an anti-PCAD synCAM (anti-PCAD, blue) (left). The anti-PCAD synCAM contains an ICAM-1 TM/ICD. Right, maximum projection images of the sorting assay in which L929 cells expressing WT PCAD (orange) were mixed with parental (top) or synCAM (bottom) L929 cells (blue). Scale bars, 50 µm. t = 0 h and 24 h. Representative images are shown of four independent replicates with additional replicates shown in Extended Data Fig. 10.

