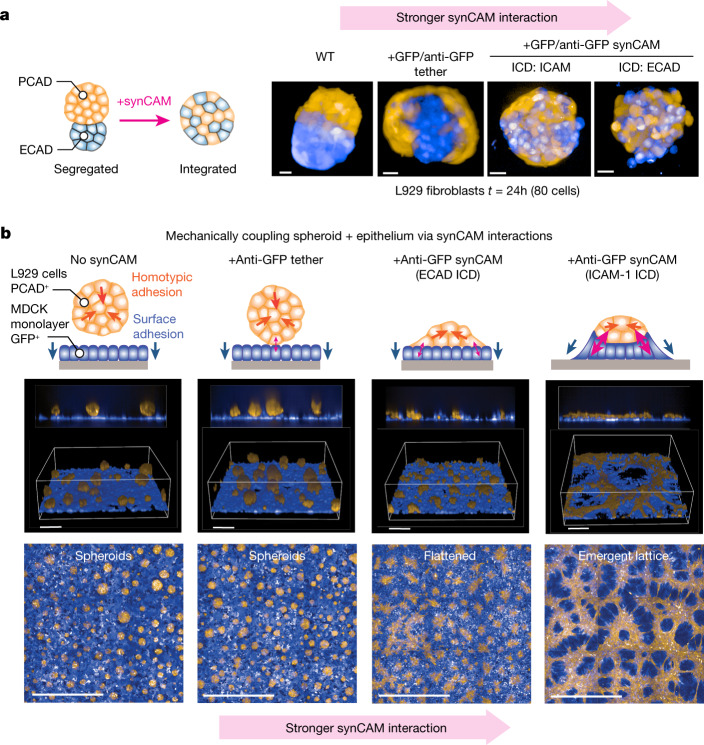
Fig. 5. Using synCAMs to reshape tissue organization.
a, Schematic of the experiment using synCAMs to force the integration of differentially sorting L929 populations. We start with L929 populations expressing WT ECAD (blue) or WT PCAD (orange), which leads to segregation into a binodal structure. The image shows how sorting is altered by the expression of integrating heterophilic synCAM with interactions of different strengths (versus the tether receptor). Maximum projections of ×20 confocal microscopy images are shown. Scale bars, 20 µm. t = 24 h. See Supplementary Video 3 for a time-lapse analysis. A similar demonstration of synCAM integration of PCAD/NCAD-segregated cell populations is shown in Extended Data Fig. 7. b, L929 cells expressing WT PCAD (orange) mixed with an MDCK monolayer (blue) form spheroids that passively sit above the MCDK epithelial layer. Adding GFP–anti-GFP synCAMs with interactions of increasing strength (versus the tether receptor) leads to increasing mechanical coupling between the epithelial and spheroid tissues. When strong enough, the two cell types form a complex lattice-like network (ICAM synCAM). The images show assembly at t = 24 h. Both 3D magnified (top) and maximum projection zoomed-out (bottom) views are shown. Scale bars, 100 µm (top) and 1 mm (bottom). See Supplementary Video 4 for a time-lapse analysis of coupled tissue evolution.

