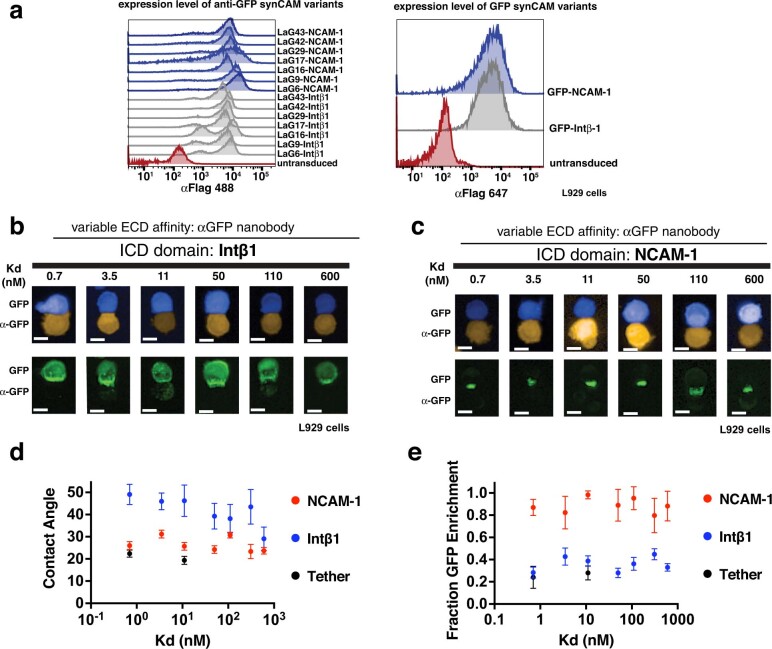
Extended Data Fig. 2. Changing ECD affinity has minor effect on function of multiple synCAMs: Intβ1 and NCAM ICDs (linked to Fig. 1f).
(a) FACS analysis of αGFP synCAM expression in L929 fibroblast cells expressing cytosolic mCherry following cell sorting. The CAM TM and ICD domain for each construct is NCAM-1 or Intβ1, and the GFP-binding llama nanobody (LaG) ECD for each construct is indicated. This analysis shows that this series of alternative affinity synCAMs are expressed at comparable levels. (b) Maximum projection of 20X confocal microscopy images of pairwise synCAM interfaces (t = 3 h, scale bar = 10 µm). Top: GFP-expressing cell (blue) is bound to an αGFP expressing cell (orange). The CAM TM and ICD domain for each pair is Intβ1. Bottom: GFP channel of the interfaces above highlighting differences of receptor enrichment at the interface. (c) Maximum projection of 20X confocal microscopy images of pairwise synCAM interfaces (t = 3 h, scale bar = 10 µm). Top: GFP-expressing cell (blue) is bound to an αGFP expressing cell (orange). The CAM TM and ICD domain for each pair is NCAM-1. Bottom: GFP channel of the interfaces above highlighting differences of receptor enrichment at the interface. (d) Plots of contact angles measured from the interfaces shown in b and c in relation to the corresponding LaG nanobody affinity (data are presented as mean values of of n = 10 pairs, error = 95 % CI). The contact angles for Intβ1 (blue) are shown in relation to NCAM-1 (red) and the tether control from Fig. 1f (black). (e) Plots of GFP enrichment measured from the interfaces shown in b and c in relation to the corresponding LaG nanobody affinity (data are presented as mean values of n = 10 pairs, error = 95 % CI). The GFP enrichment for NCAM-1 (red) are shown compared to Intβ1 (blue) and the tether control from Fig. 1f (black).

