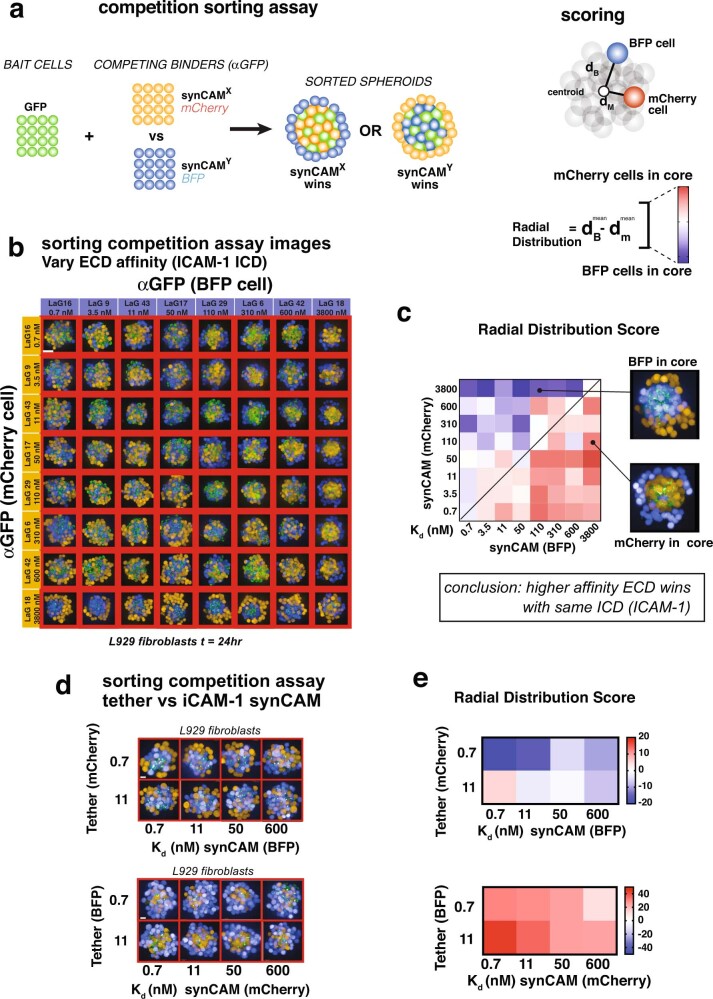
Extended Data Fig. 3. Differential sorting of synCAMs with varying ECD affinity and ICD (linked to main Fig. 1f).
(a) Cartoon depiction of the differential sorting competition assay (left) and quantification of radial distribution that is represented as a heat map (right). This experiment represents an alternative way to measure adhesion preferences/strength of the diverse synCAM-driven cell–cell interactions that differs from the contact angle measurement shown in Fig. 1f. Here we mix surface GFP L929 cells (bait cells) with two competing differentially labelled L929 cells, each with a different αGFP synCAM. Stronger adhesion of the synCAM is assessed via the relative degree of co-sorting of the competitor cells to the core in conjunction with the bait cells. We calculate the radial distribution of competing cells (red/blue) from the centroid of the spheroid. (b) Representative maximum projection images of cell sorting competition assay between L929 cells expressing αGFP-ICAM-1 with the indicated ECD LaG nanobody (mCherry or BFP) mixed with L929 cells expressing GFP-ICAM-1 (t = 24 h, scale bar = 50 µm). (c) Quantification of the cell sorting competition assay from b (n = 4). (d) Representative maximum projection images of cell sorting competition assay between L929 cells expressing αGFP-ICAM-1 and cytosolic and L929 cells expressing αGFP-Tether mixed with L929 cells expressing GFP-ICAM-1 (scale bar = 20 µm, t = 24 h). (e) Quantification of the cell sorting competition assay from d (n = 4).

