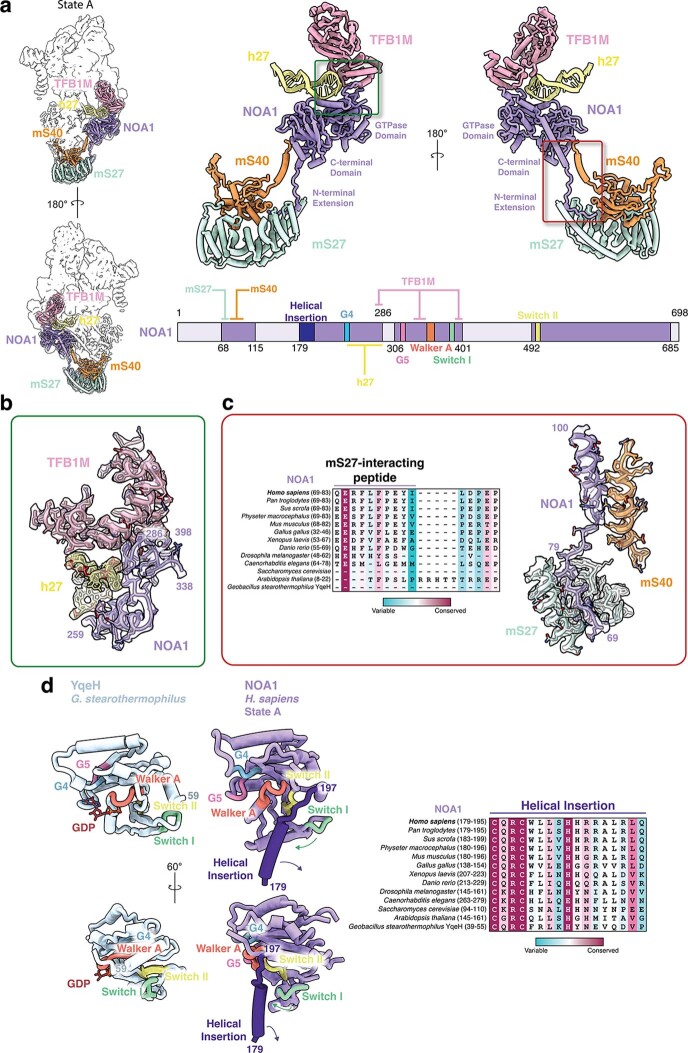
Extended Data Fig. 2. Details of NOA1 function within State A.
(a) Interaction network of NOA1 in State A in context with the entire complex (left), shown in cartoon (right), and in a schematic (bottom). (b) Model and cryo-EM map of region highlighted in green in (a). (c) Conservation analysis of NOA1 N-terminal peptide region (left) and molecular context, shown as model and cryo-EM density. (d) Models of the GTPase domain of related circularly permutated GTPase YqeH (left, PDB:3EC1)38 compared to NOA1 (right). Conserved GTPase motifs are colored and labeled. Proposed rearrangements of NOA1 occurring during GTP binding are shown as arrows. Conservation analysis of the helical insertion in the GTPase domain (right).

