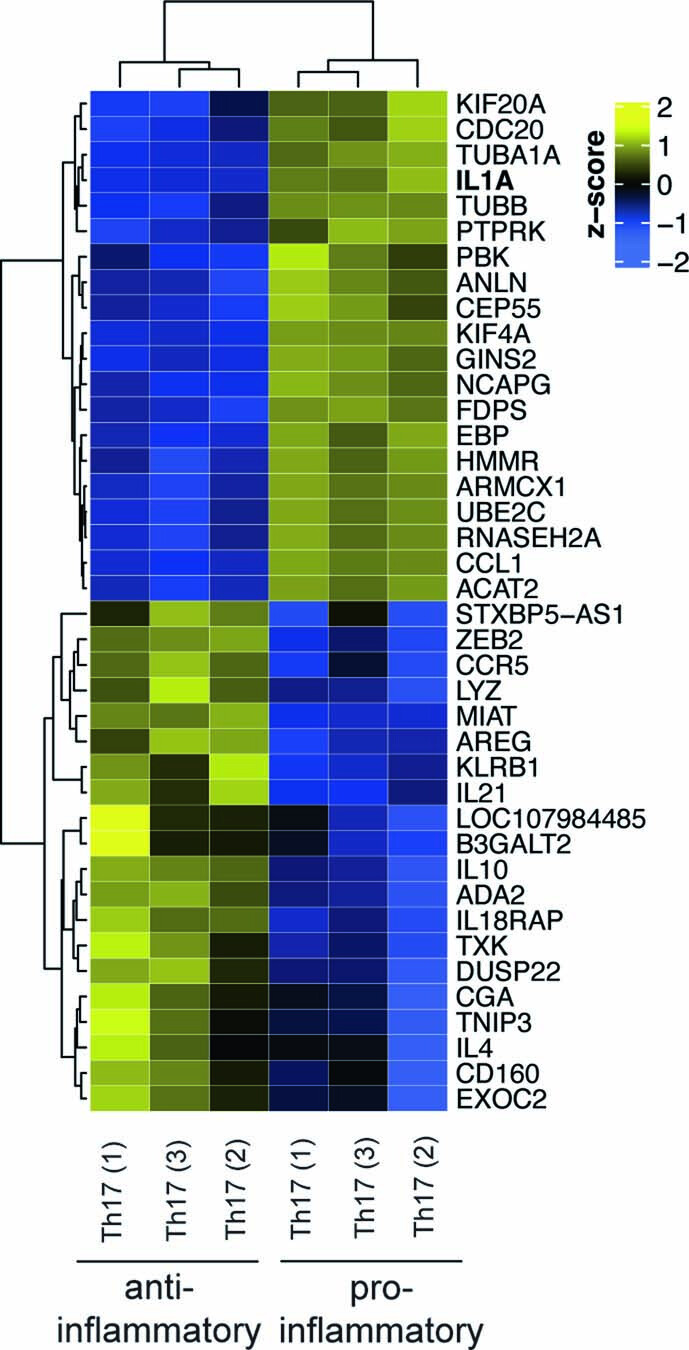
Extended Data Fig. 2. Differential gene expression between pro- and anti-inflammatory human Th17 cells.

Shown is a heatmap displaying the top 20 up- and downregulated genes (by order of significance) of the transcriptome following stimulation of human Th17 cells with anti-CD3 and anti-CD28mAbs for 5 days in the presence (proinflammatory) or absence (anti-inflammatory) of exogenous IL-1β. The samples and genes were clustered according to the pattern of expression using k-means clustering.
