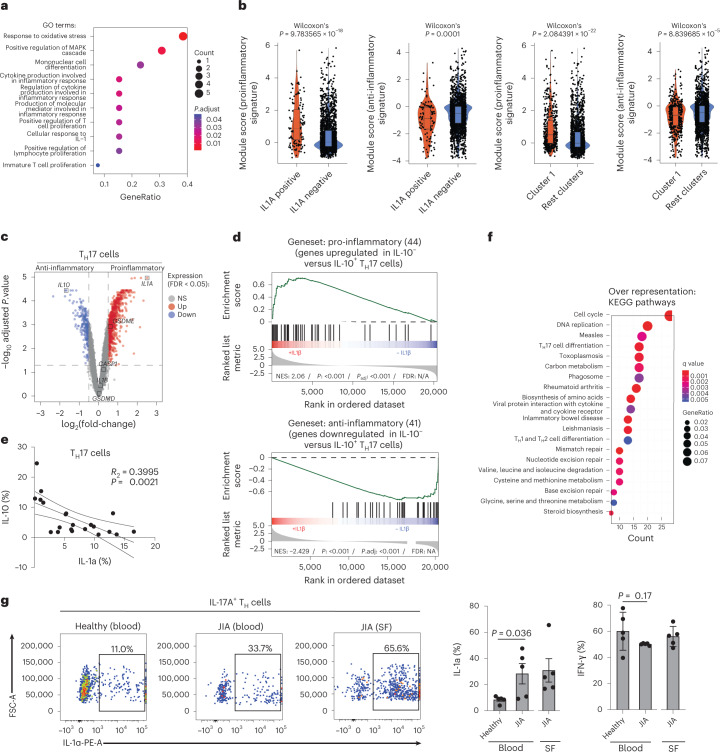
Fig. 2. IL-1α producing TH17 cells are proinflammatory.
a, Enrichment analysis using clusterprofiler with genes coexpressed with IL1A as determined in Extended Data Fig. 3a,b. The top 10 GO terms out of 150 significant GO terms are shown. b, Expression of pro- and anti-inflammatory gene sets obtained from public data7 in TH17 cells analyzed by scRNA-seq after grouping single cells into IL1A+ and IL1A− TH17 cells and after Leiden clustering (Wilcoxon’s rank-sum test). c, Transcriptome analysis showing DEGs (red, upregulated; blue, downregulated; gray, nonsignificant genes) of pro- versus anti-inflammatory TH17 cells after 5 d of polyclonal stimulation in the presence or absence of IL-1β, respectively. d, GSEA of TH17 cells from c. The gene sets were established from a public dataset7 after transcriptomic comparison of IL-10– versus IL-10+ TH17 cell clones. N/S, not significant; NES, normalized enrichment score. e, Intracellular cytokine staining and flow cytometric analysis of TH17 cells stimulated for 5 d with anti-CD3 and anti-CD28 monoclonal antibodies. f, Overrepresentation of KEGG pathways within the DEGs from the transcriptomic comparison of pro- versus anti-inflammatory TH17 cells. g, Intracellular cytokine staining and flow cytometry (left, representative experiment; right, cumulative data) of T cells (from blood and synovial fluid (SF) of patients suffering from JIA and healthy control donors). IL-17A+ gated TH cells are shown (paired Student’s t-test; n = 5 independent patients and healthy donors).

