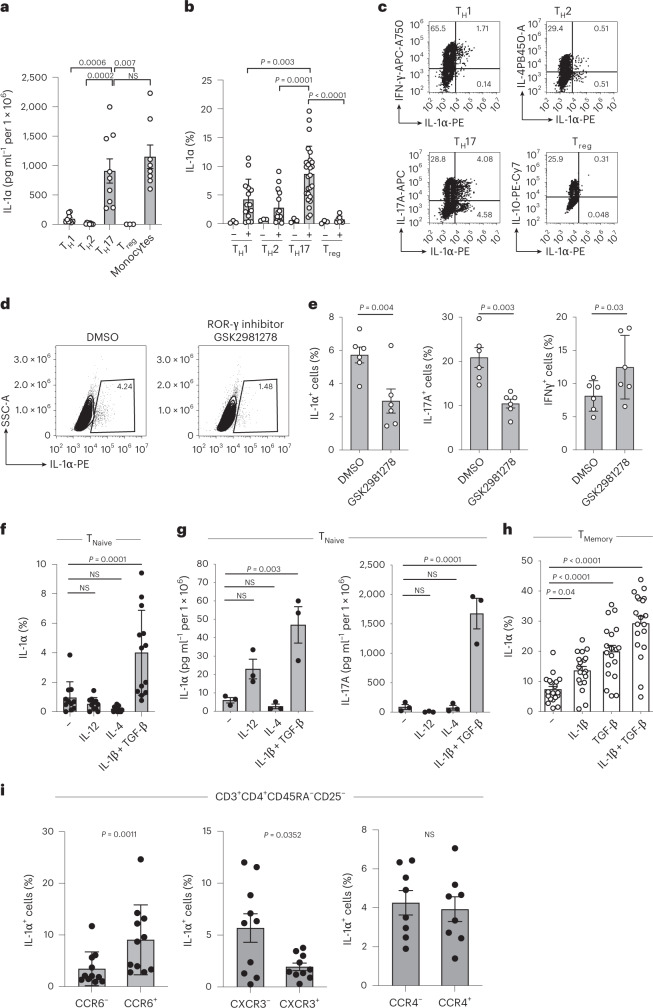
Fig. 3. IL-1α production by T cells is restricted to the TH17 cell fate.
a, ELISA of cell culture supernatants of TH cell subsets after stimulation with anti-CD3 and anti-CD28 monoclonal antibodies for 5 d. Monocytes were stimulated with LPS for 24 h and nigericin for the last 30 min (one-way analysis of variance (ANOVA) with Dunnett’s multiple-comparison test). b–f,h, Intracellular cytokine staining and flow cytometric analysis of cells stimulated as in a (one-way ANOVA with Dunnett’s multiple-comparison test (b, f and h), two-tailed paired Student’s t-test (e)). DMSO, Dimethysulfoxide; NS, not significant. g, ELISA of cell culture supernatants from cells stimulated as in f (one-way ANOVA with Dunnett’s multiple-comparison test). i, Intracellular cytokine staining and flow cytometry of memory TH cells sorted positively and negatively for specific chemokine receptors. The analysis was performed after 5 d of stimulation with anti-CD3 and anti-CD28 monoclonal antibodies (two-tailed, paired Student’s t-test). Data are presented as mean ± s.e.m. Each circle indicates an independent biological sample representing a blood donor.

