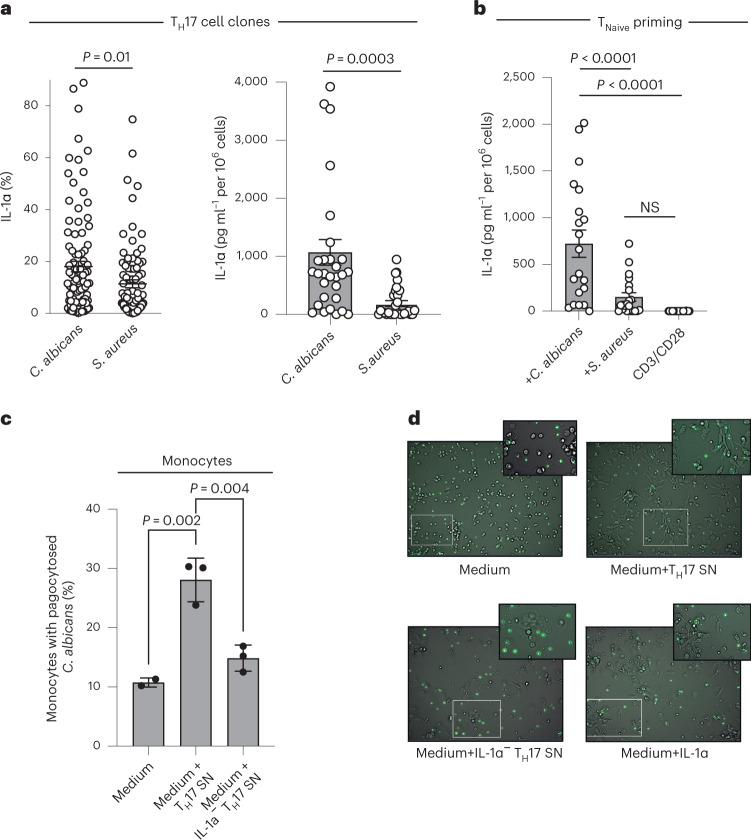
Fig. 8. TCR specificity controls IL-1α production contributing to C. albicans clearance.
a, Intracellular cytokine staining and flow cytometry (left) and ELISA (right) of C. albicans- versus S. aureus-specific TH17 cell clones from three individual blood donors 14 d after single-cell TH17 cell cloning with irradiated feeder cells and restimulation for 5 d with anti-CD3 and anti-CD28 monoclonal antibodies. The microbial antigen-specific TH17 cells were isolated for subsequent cloning as a carboxyfluorescein succinimidyl ester (CFSE)-negative population after their restimulation with microbe-pulsed autologous monocytes. Each circle indicates an individual T cell clone (n = 30 TH cell clones, 10 clones per healthy blood donor). Data are presented as mean ± s.e.m. (two-tailed, unpaired Student’s t-test). b, Naive TH cells were primed by either C. albicans- or S. aureus-pulsed monocytes. Each circle indicates an individual T cell clone. The ELISA analysis of supernatants after restimulation of each clone with anti-CD3 and anti-CD28 monoclonal antibodies for 5 d is shown (n = 19, 4–5 clones per healthy blood donor; one-way ANOVA with Tukey’s multiple-comparison test). c, Flow cytometric analysis of phagocytosis of FITC-labeled, heat-inactivated C. albicans yeast by monocytes preincubated for 18 h with IL-1α replete or depleted (immunoabsorption or CRISPR–Cas9 KO) TH17 cell supernatants (n = 3 independent biological samples; one-way ANOVA with Tukey’s multiple-comparison test). Each circle indicates an independent blood donor. d, Real-time live cell in vitro imaging (videos in Supplementary Video 1, time points) of monocytes in coculture with FITC-labeled C. albicans as in c. Representative snap shots with magnifications of the videos are shown at a time point 2 h after addition of C. albicans.

