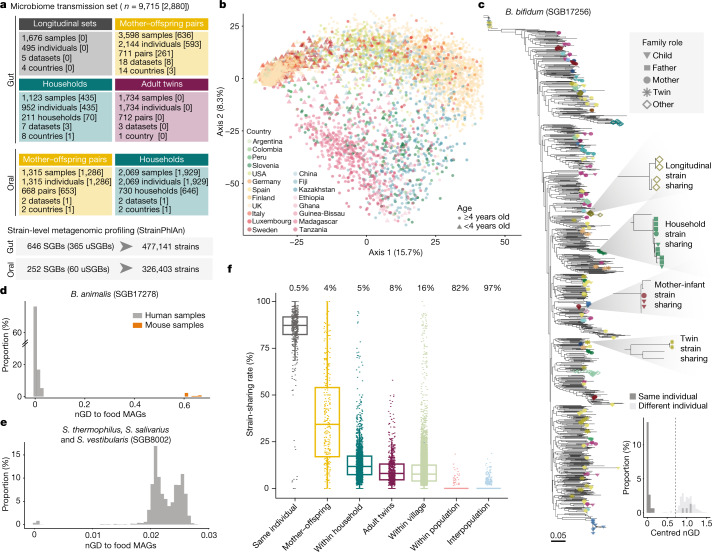
Fig. 1. A metagenomic framework to survey person-to-person microbiome strain transmission.
a, Overview of the study and dataset based on the SGB framework (Methods). Numbers in square brackets are the number of units sequenced in this study. b, Overall species-level structure of the gut samples (principal component analysis on Aitchison distance, one random sample per individual, n = 4,840). Samples are coloured by country and shapes indicate age. c, Phylogeny of B. bifidum (SGB17256) (Methods), a low-prevalence highly transmitted species (Supplementary Table 9), showing the genetic diversity of strains and the shared strains between samples of the same individual and between different individuals. One example of strain sharing is highlighted for each relationship type. Tree leaves involved in strain-sharing instances are coloured by dataset (Extended Data Fig. 1b) and their shapes reflect kinship. Bottom, the distribution of pairwise centred nGDs of the species in individuals sampled at two time points (less than six months apart, ‘same individual’) and in unrelated individuals (‘different individual’; Extended Data Fig. 3 and Methods), confirming the suitability of the methodology to infer strain identity. d,e, The distribution of pairwise nGDs between B. animalis (SGB17278) (d) and S. thermophilus, S. salivarius and S. vestibularis (SGB8002) (e) strains reconstructed from human gut metagenomes or mouse samples and MAGs reconstructed from fermented food40. The presence of B. animalis in humans is associated with the consumption of commercial dietary products (Extended Data Fig. 4a), whereas only a subset of S. thermophilus, S. salivarius and S. vestibularis strains is associated with fermented food intake (Extended Data Fig. 4b). f, Person-to-person strain-sharing rates (number of shared strains/number of shared SGBs × 100%) across relationship types. All comparisons are statistically significant (Kruskal–Wallis test, n = 26,218, χ2 = 11,420, P < 2.2 × 10⁻¹⁶, post hoc Dunn tests, Padj < 0.05; Supplementary Table 7). In box plots, box edges delineate lower and upper quartiles, the centre line represents the median and whiskers extend to 1.5 times the interquartile range (IQR). The number along the top is the percentage of pairs between which no strain-sharing event was detected.

