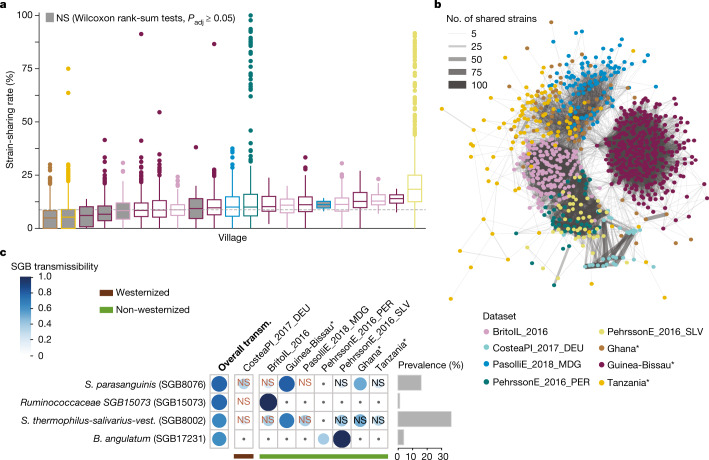
Fig. 4. Gut microbiome transmission along villages and populations.
a, Person-to-person strain-sharing rates in different households of a village (n = 1,132). The dashed line shows the median strain-sharing rate among individuals in different villages of the same dataset. In box plots, box edges delineate lower and upper quartiles, the centre line represents the median and whiskers extend to 1.5 times the IQR. Grey-filled boxes show non-significant differences between the within village and inter-village person-to-person strain-sharing rate (Wilcoxon rank-sum two-sided tests, Padj ≥ 0.05; Supplementary Table 23). b, Gut microbiome strain-sharing unsupervised network of individuals in household datasets displaying population structure. Line width is proportional to the number of shared strains. c, Highly transmitted SGBs between individuals in different households (SGB transmissibility >0.5 and significantly higher intra-population than inter-population transmissibility), and transmissibility of these SGBs in specific datasets (classified by westernization status). NS, non-significant SGB transmissibility in the category (Chi-squared two-sided tests on the number of transmitted and non-transmitted SGBs between inter-household pairs and between pairs in different datasets; Supplementary Table 24). Only comparisons with at least three possible transmissions (species shared by at least three pairs) are shown; comparisons with less than three possible transmissions appear with a dot. Prevalence is defined as the percentage of samples in which the SGB was detected. Novel datasets from the present study are highlighted with asterisks.

