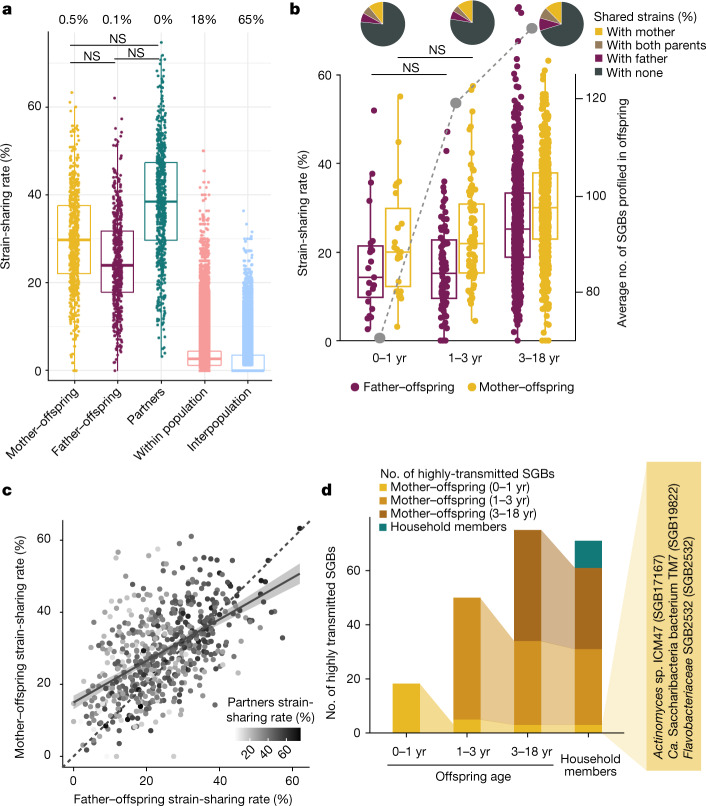
Fig. 5. Transmission of the oral microbiome.
a, Person-to-person strain-sharing rates (number of shared strains/number of SGBs in common × 100%) across relationships (n = 2,069). All comparisons are statistically significant unless stated otherwise (Kruskal–Wallis test, n = 26,218, χ2 = 11,420, P < 2.2 × 10⁻¹⁶, post hoc Dunn two-sided tests, Padj < 0.05; Supplementary Table 28). Numbers along the top show the percentage of pairs between which no strain-sharing event was detected. b, Mother–offspring and father–offspring sharing rates (number of shared strains/number of SGBs in common × 100%) (n = 2,069) (left axis; box plot and non-grey dots) and median number of SGBs detected in the offspring (right axis; grey dots). Post hoc Dunn two-sided tests, Supplementary Table 29. All comparisons are statistically significant after correction for multiple testing unless stated otherwise. In box plots, box edges delineate lower and upper quartiles, the centre line represents the median and whiskers extend to 1.5 times the IQR. Pie charts show the percentage of strains shared between pairs of individuals. c, Strain sharing across cohabiting individual relationships are positively correlated (Spearman’s two-sided tests, mother–offspring and father–offspring: n = 637, ρ = 0.52, P < 2.2 × 10⁻¹⁶; mother–offspring and partners: n = 611, ρ = 0.21, P = 1.2 × 10⁻⁷; father–offspring and partners: n = 611, ρ = 0.38, P < 2.2 × 10⁻¹⁶). Dashed line is the diagonal, where mother–offspring strain-sharing rate is equal to father–offspring strain-sharing rate. The shaded area shows the 95% confidence interval. d, The persistence of highly transmitted SGBs (SGB transmissibility >0.5 and significantly higher intra-household than inter-household transmissibility) between mother and offspring across age categories and among household members who are at least four years of age. Ca., Candidatus.

