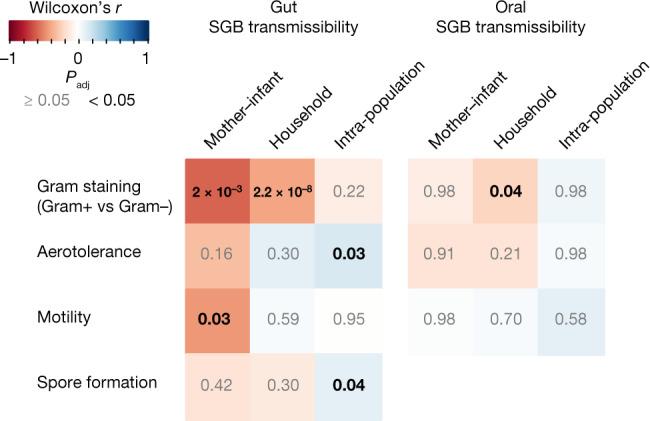
Fig. 6. Association between gut and oral species transmissibility and phenotypical properties.

SGB phenotypes were inferred using Traitar60 (Methods). Association between SGB transmissibility and predicted phenotypes was assessed with Wilcoxon rank-sum two-sided tests on the 25% of SGBs displaying the highest transmissibility and compared with the 25% of SGBs displaying the lowest transmissibility for each transmission mode and environment. Colours represent the Wilcoxon r statistics; significant Padj values are shown in black (Padj < 0.05) and in grey otherwise.
