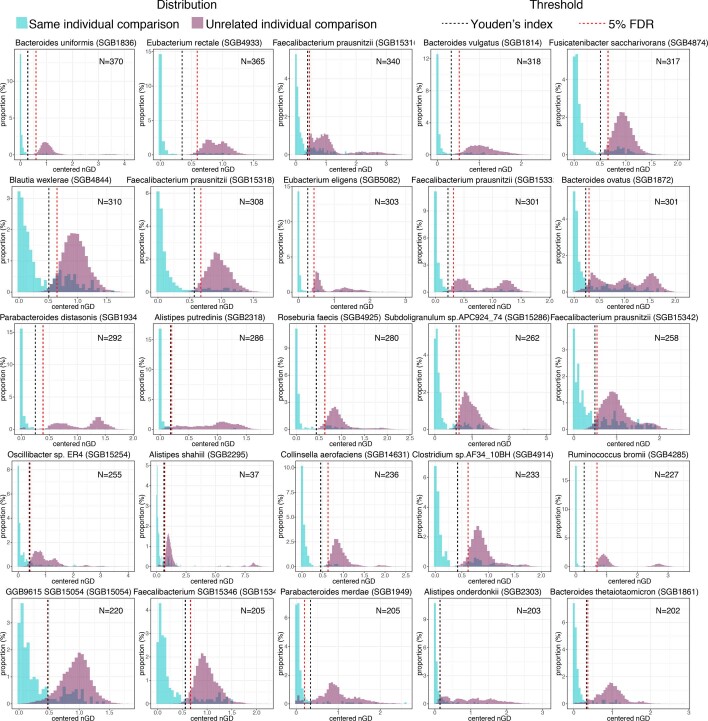
Extended Data Fig. 3. Species-specific operational definitions of strain.
Comparison of same-individual (green) to unrelated individual (purple) genetic distance comparisons for the 25 most prevalent SGBs in gut metagenome longitudinal datasets. Strain identity thresholds were set as the Youden’s index (black dashed line) or as the 5th percentile of the unrelated individual comparisons (red dashed line) when the first was above 5% (e.g. Parabacteroides merdae [SGB1949]). Centred nGD: normalised phylogenetic distance divided by the median nGD of the phylogenetic tree. The N in each histogram corresponds to the number of same-individual comparisons in which each SGB was profiled at strain-level.

