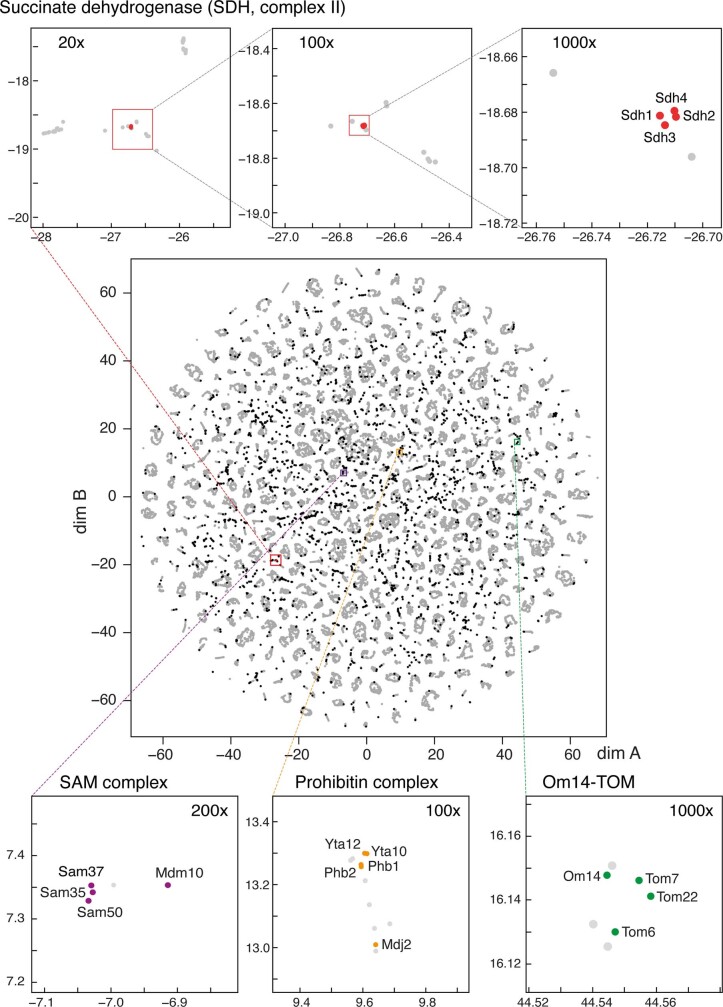
Extended Data Fig. 5. Visualization of the matching analysis within the MitCOM dataset.
Center, Plot showing t-distributed stochastic neighbourhood distribution (t-SNE) of the entirety of protein abundance profile segments (49,111) represented by dots. Results of the automated Gaussian-fitting (Fig. 1c) were used to define ‘seeds’ (black dots) for Pearson correlation with the corresponding sections of all 906 MitCOM protein profiles (see also Viewer tool in Extended Data Fig. 3c). Similarity scores (Methods and Extended Data Fig. 4) were calculated for all protein sections (components) with r > 0.95 (grey dots) and used as distance measure for t-SNE. As a result, close co-localization on this map indicates potential association of the respective proteins into one or more complexes with a defined apparent molecular mass (i.e. localization in Fig. 1c). Top insets are stepwise zooms into the plot resolving a closely co-localized group of protein profile segments representing the main peak of succinate dehydrogenase (respiratory chain complex II) assembled from four subunits Sdh1–4. Note the exquisite co-localization and discrimination of these subunit even at highest magnification factors (indicated in each inset). Bottom insets are magnification of the framed windows in the central plot demonstrating close co-localization of profile segments of biochemically verified subunits of the indicated multi-protein complexes: SAM complex (left), prohibitin/m-AAA supercomplex (middle), assembly of Om14 with TOM (right).

