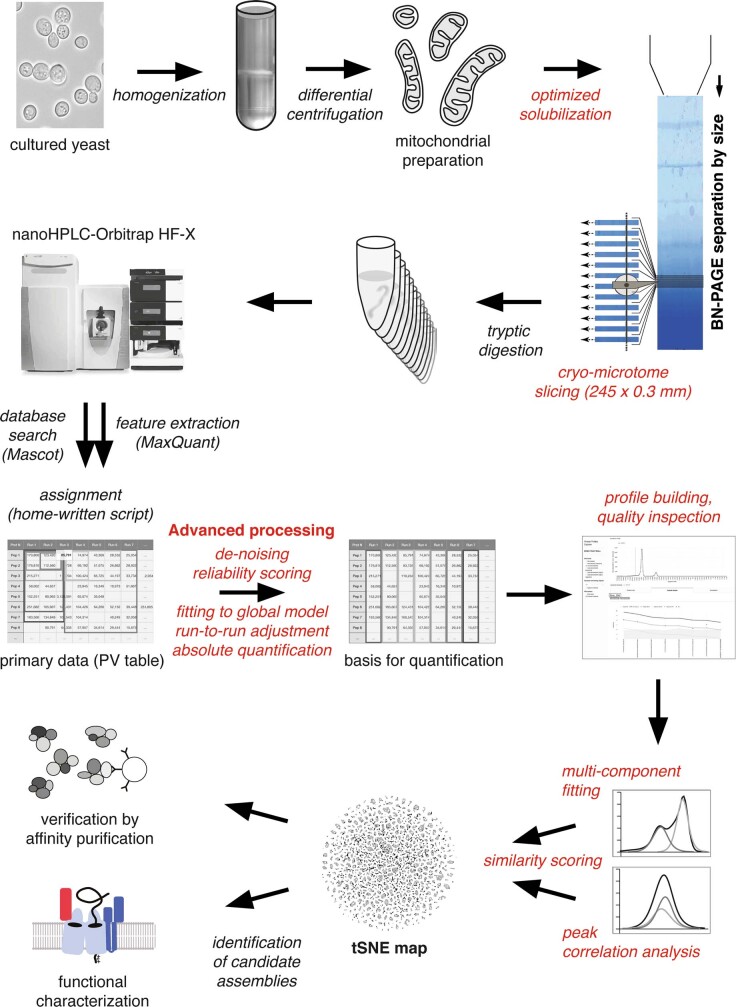
Extended Data Fig. 1. Experimental workflow for determination and evaluation of MitCOM.
Scheme illustrating major materials, tools and intermediates used to generate the MitCOM dataset and to identify protein complexes together with their subunit composition (for details see Methods). Novel or significantly improved tools or procedures are highlighted in red. Quality and usability of MitCOM benefitted particularly from the high-resolution sampling of the blue native gel, the advanced processing of MS-data for determination of accurate protein abundance–mass profiles and the new viewer toolbox including multi-Gaussian component fitting and correlation analysis. Note that the final assignment of protein profile peaks to a distinct complex requires biochemical verification by affinity purification and functional analysis. We used elements of Figs. 1a, 5h, Extended Data Figs. 3b, 5 and an adapted image of Thermo Scientific™ Q Exactive™ HF-X hybrid quadrupole-Orbitrap™ MS for illustration (permission by copyright owner: Thermo Fisher Scientific Inc., Waltham, MA, USA).

