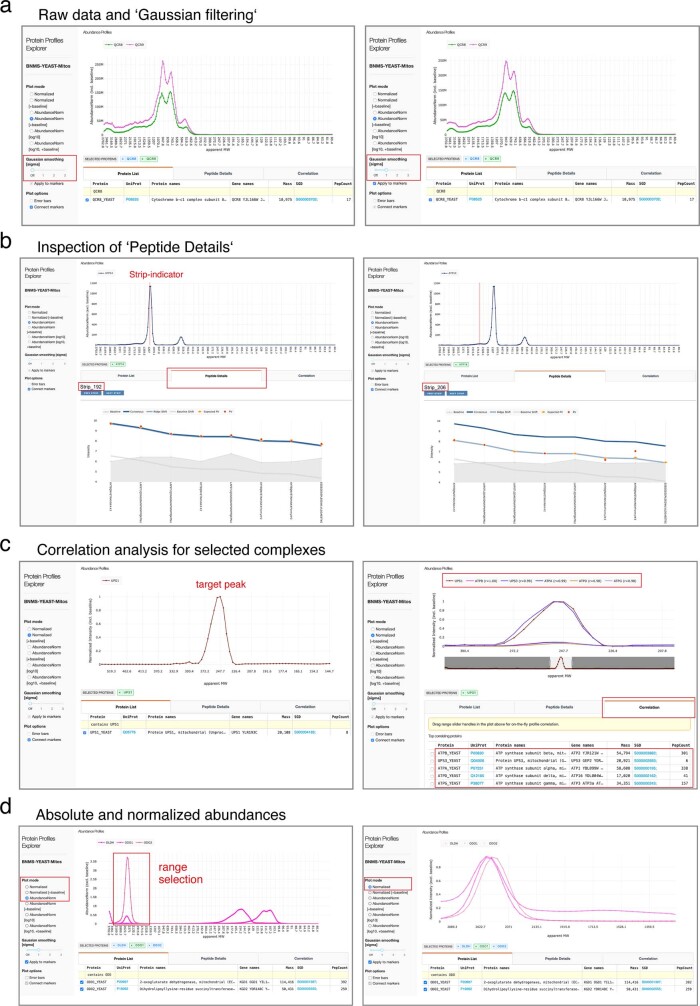
Extended Data Fig. 3. Using the Profile Viewer for interactive data exploration.
Illustration of a selected set of functions (highlighted in red) for targeted data inspection and analysis implemented in the MitCOM Profile Viewer (https://www3.cmbi.umcn.nl/cedar/browse/experiments/CRX36 or, with extended functions, at https://www.complexomics.org/datasets/mitcom). The features include profile visualization and inspection of quantification details, as well as custom-defined MitCOM-wide Pearson correlation analysis for searching constituents of protein complexes. a, adjustable Gaussian smoothing of displayed abundance–mass profiles; b, inspection of peptide details used for protein quantification (i.e. underlying the selected datapoint) and generation of the abundance–mass profile(s); c, correlation analysis tool. A region of interest is targeted (‘target peak’) within the profile of a selected protein (left). Correlation analysis is started by clicking the “correlation” tab that opens a range-selection panel in which left and right boundaries of the target peak can be set by dragging the range-slider handles. Simultaneously, a list of 20 proteins exhibiting the highest Pearson correlation with the selected target peak segment is displayed (right, calculation in real time); d, normalization of selected sets of proteins to their maximum. A help page with detailed user instructions is available on the Viewer’s main window.

