Figure 2.
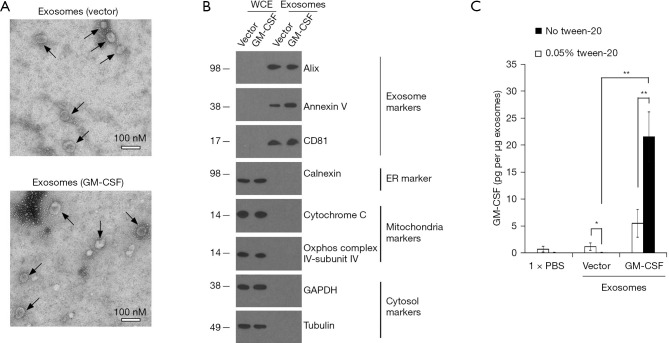
Evaluation of exosomes isolated from ES-D3 cells. (A) TEM images of exosomes acquired from GM-CSF-expressing ES-D3 cells or their vector control counterparts. Scale bar 100 nM. Individual exosomes are indicated by arrows. (B) Western blot evaluation of the indicated markers of exosomes, ER, mitochondria and cytosol in WCE or exosomes. Molecular weights markers (kD) are indicated on the left. (C) The amounts of GM-CSF in the indicated exosomes were measured by ELISA. Exosomes were pretreated with or without 0.05% Tween-20, and ELISA assays were conducted using washing buffer containing either PBS only or PBS + 0.05% Tween-20. The data are presented as mean ± SD of three independent ELISA measurements. *, P<0.05; **, P<0.01; Unpaired Student’s t tests. GM-CSF, granulocyte-macrophage colony stimulating factor; WCE, whole cell extracts; ER, endoplasmic reticulum; PBS, phosphate buffered saline; TEM, transmission electron microscopy; SD, standard deviation.

