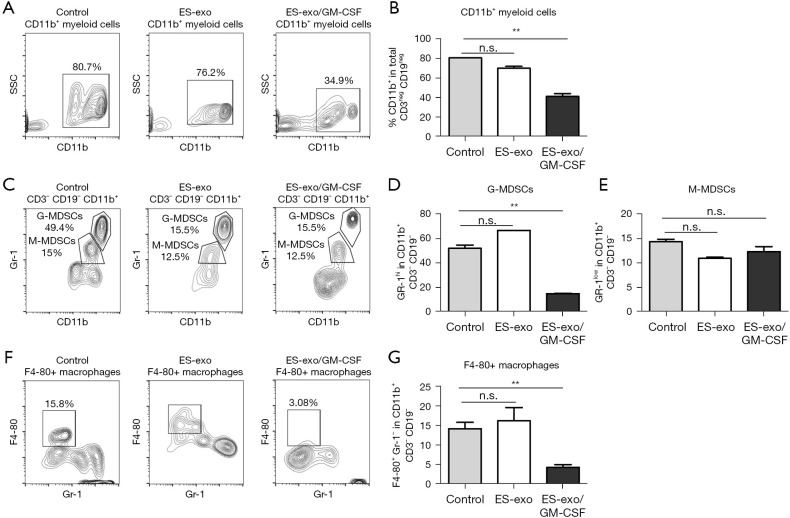
Figure 6.
Vaccination of ES-exo/GM-CSF suppresses tumor-infiltrating MDSCs and macrophages. Female C57BL/6 mice were vaccinated with PBS or ES-exo or ES-exo/GM-CSF twice (days 0 and 7) and challenged by tail vein inoculation of LLC cells one week later. MDSCs infiltrating into lung tumors were examined 5 weeks after LLC injection. Intratumoral immune cells were identified by CD45, a pan-hematopoietic marker. (A) Dot plots showing the abundance of CD11b+ cells in tumor-infiltrating non-T (CD3−) and non-B (CD19−) immune cells obtained from control, ES-exo and ES-exo/GM-CSF-vaccinated mice. The percentages of the individual subpopulation are shown. (B) The data shown in (A) are summarized with 4 mice in control and ES-exo group, 6 mice in ES-exo/GM-CSF group. Mean ± SD, **, P<0.01; ANOVA with Tukey’s multiple comparison test. (C) Gr-1high G-MDSCs and Gr-1low M-MDSCs in CD11b+ populations shown in (A) were examined. The percentages of each subpopulation are indicated in the graphs. (D,E) Bar graphs show the summarized data presented in (C) (n=4 in control and ES-exo group, n=6 in ES-exo/GM-CSF group); mean ± SD; **, P<0.01; ANOVA with Tukey’s multiple comparison test. (F) The percentages of F4-80+GR-1− macrophages in intratumoral non-T (CD3–) and non-B (CD19–) immune cells from control, ES-exo and ES-exo/GM-CSF-vaccinated mice are shown. Numbers in the plots represent the percentages of each subpopulation. (G) Bar graphs showing the average of percentages of F4-80+GR-1− macrophages obtained from control, ES-exo and ES-exo/GM-CSF-vaccinated mice (n=4 in control and ES-exo group, n=6 in ES-exo/GM-CSF group); mean ± SD; **, P<0.01; ANOVA with Tukey’s multiple comparison test. ES, embryonic stem; GM-CSF, granulocyte-macrophage colony stimulating factor; n.s. not significant; MDSC, myeloid derived suppressor cell; PBS, phosphate buffered saline; LLC, Lewis lung carcinoma; SD, standard deviation; ANOVA, analysis of variance; G-MDSC, granulocytic MDSC; M-MDSC, monocytic MDSC.

