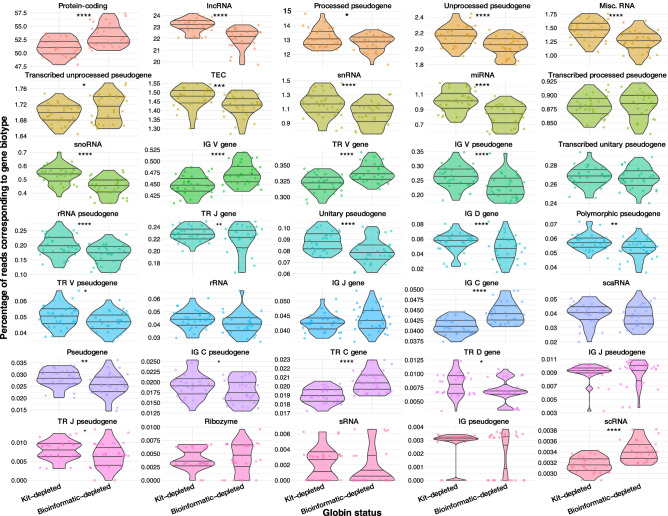
Figure 2.
Distributions of reads mapping to distinct gene biotype regions of the genome between kit- and bioinformatic-depleted samples. Violin plots depicting the distribution of the proportion of reads from each library method (n = 29 samples per method) mapping to portions of the genome associated with specific gene biotypes. Percentages were calculated after the bioinformatic removal of haemoglobin protein-coding genes from all samples. Each dot represents and individual sample from each library method. Horizontal lines indicate the median, 1st quartile and 3rd quartile while the ends of the “violin” indicate the lower and upper adjacent values. A paired t test was performed to compare each group of samples with and without prior globin depletion and the Bonferroni-corrected p values are displayed; * < 0.05, ** < 0.005, **** < 0.00005.

