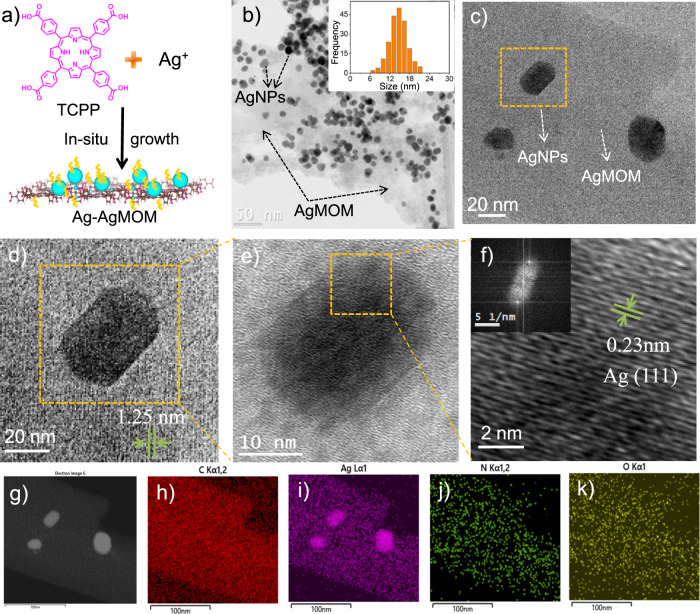
Fig. 1. Morphology characterizations of Ag–AgMOM.
a Schematic diagram of the one-step synthesis of Ag–AgMOM using in-situ solvothermal method. b Typical low magnified TEM image of Ag–AgMOM with reaction time 28 h. Inset is the statistical size distribution of Ag nanoparticles (AgNPs). c, d Enlarged TEM images of Ag–AgMOM; the lattice of AgMOM was observed. e, f HR-TEM images and crystal lattice of a single Ag nanoparticle (AgNP) on AgMOM in (d) (inset is the FFT image of the AgNP). g High-angle annular dark-field (HAADF) image of Ag–AgMOM. h–k Mapping of carbon (C), silver (Ag), nitrogen (N) and oxygen (O) elements in Ag–AgMOM, respectively. Source data are provided as a Source Data file.

