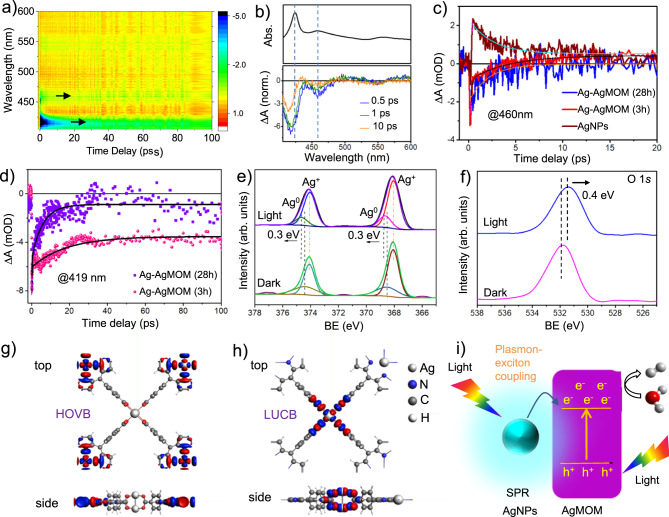
Fig. 5. Photocatalytic mechanism studies of Ag–AgMOM photocatalyst.
Femtosecond transient absorption spectra in a contour diagram a and at selected time delays b of Ag–AgMOM (3 h) sample, obtained with a pump wavelength of 400 nm. The steady-state absorption spectrum is also shown at the top in b for comparison. c Transient time traces at the probe wavelength of 460 nm for AgNPs, Ag–AgMOM (3 h) and Ag–AgMOM (28 h) samples. d Transient time traces at the strongest exciton wavelength of 419 nm for both Ag–AgMOM (3 h) and Ag–AgMOM (28 h) samples. High-resolution XPS spectra for Ag 3d (d), O 1s (e) and N 1s (f) of Ag–AgMOM (4 h) with or without 420 nm LED irradiation (BE: binding energy). DFT calculated highest occupied valence band (HOVB) (g) and lowest unoccupied conduction band (LUCB) (h) topologies of MOM. i Proposed visible-driven photocatalytic mechanism of Ag–AgMOM. Source data are provided as a Source Data file.

