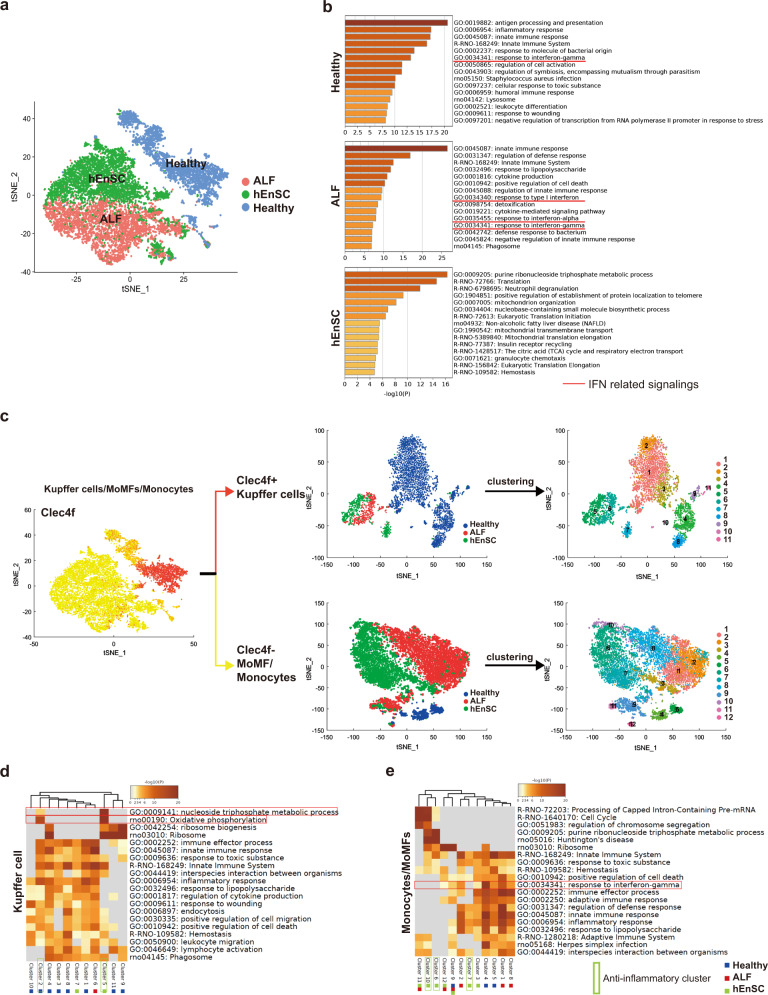
Fig. 3. Single-cell transcriptomic analyses of liver macrophages reveal phenotypical and functional changes in cell subpopulations.
a t-SNE plot of the monocyte/MoMF/Kupffer cell populations isolated on day 3 post drug administration and transplantation from healthy (blue), PBS-treated ALF (red) and hEnSC-transplanted ALF (hEnSC) (green) rat livers. For each sample of scRNA-seq, the monocyte/MoMF/Kupffer cell populations isolated from 3 independent animals under identical treatment were combined. Cells other than monocytes/MoMFs/Kupffer cells were removed by pan-macrophage marker Cd68 before analysis. Batch effect was corrected based on the expression of the house-keeping genes. b Top 15 GO terms enriched in each indicated condition. IFN signaling-related GO terms are underscored with red lines. c t-SNE plots showing the separation and clustering of Kupffer cell (Clec4f+) and MoMF/monocyte (Clec4f–) populations based on the expression of Kupffer cell marker Clec4f. d, e GO analysis of cell subpopulations in Kupffer cell and infiltrated monocyte/MoMF cohorts as shown in c. The sample constitutions of each cluster are marked by color-coded squares. Blue: healthy group; Red: PBS-treated ALF group; Green: hEnSC-transplanted ALF group. Anti-inflammatory clusters are marked with green frames. See also Supplementary information, Figs. S8–S11.

