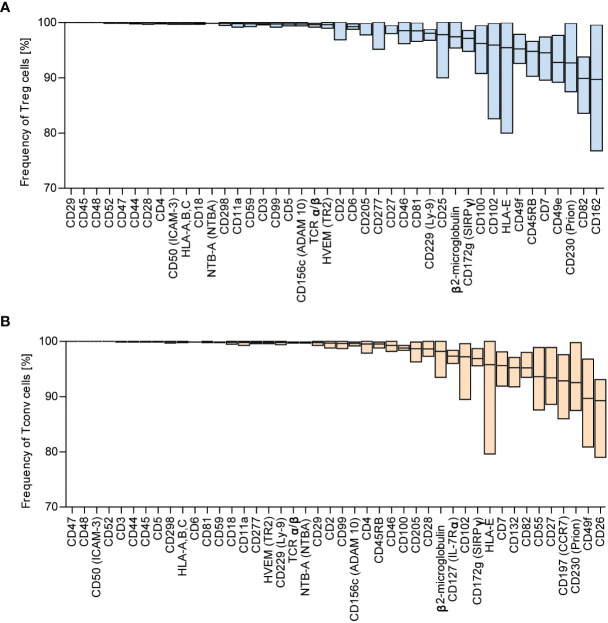
Figure 2.
Surface markers are highly expressed across Tconv and Treg cells. Based on frequency distribution analyses, the highly expressed surface markers were identified ( Figure 1B ). The percent positive cells for the given marker were in the range of 88.99 – 100%. (A) Treg and (B) Tconv cells. Data are presented as floating bars (min to max, the line indicates mean) and show the percentage of Treg or Tconv cells positive for distinct surface markers (n=5, for both Treg and Tconv).

