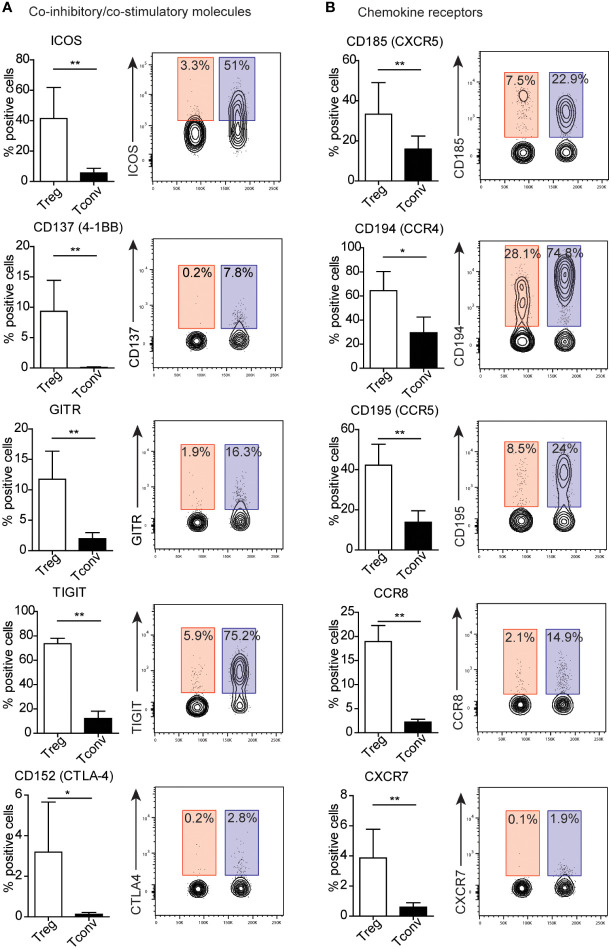
Figure 3.
Treg cells exhibit distinct patterns of expression of co-inhibitory and co-stimulatory molecules and chemokine receptors. (A) Co-inhibitory and co-stimulatory molecules and (B) chemokine receptors, Numbers adjacent to gates on contour plots indicate the percent gated cells as positive for the given surface marker (blue – Treg, red – Tconv cells). To compare Treg and Tconv cells, plots were made by the concatenation function by FlowJo. Data are presented as bars (n=5, for both Treg and Tconv). All data represent the mean ± SD. *P ≤ 0.05 and **P ≤ 0.01 (Mann Whitney test (A, B).

