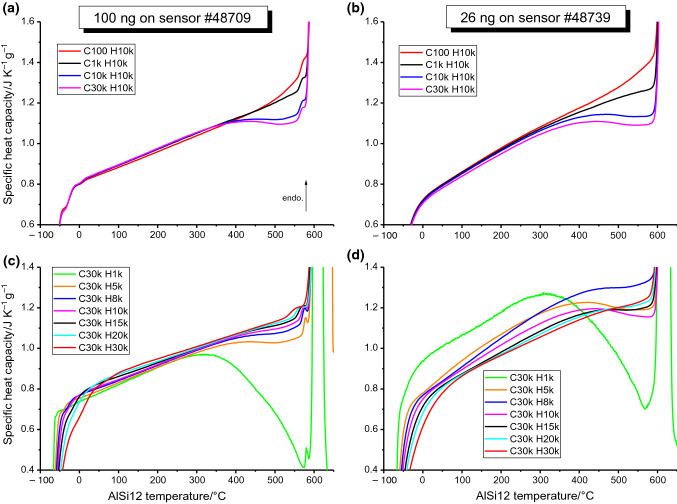
Fig. 5.
Apparent heat capacity curves on heating 2 samples of AlSi12 with various thermal histories. Panels a and b compare the measured heat capacity on heating at + 10,000 K s−1 after different prior cooling rates for a 100 ng and 26 ng sample, respectively, whilst c and d compare the measured heat capacity on heating the same respective samples at various rates after a prior cooling of − 30,000 K s−1. The distinct drop in apparent heat capacity above ~ 400 °C is present only for thermal histories involving a rapid prior cooling, is reduced for faster heating rates, and is attributed to the exothermic decomposition of the super saturated solid solution produced upon rapid cooling. The 26 ng sample in d sees significant inconsistencies across different heating rates, though nevertheless follows the same trend of faster heating rates corresponding to a smaller apparent cp drop. The upward inflexion of the C100H10k curves (red) before the onset of melting may be due to the dissolution of silicon that precipitated during the − 100 K s−1 cooling step, prior

