Fig. 1.
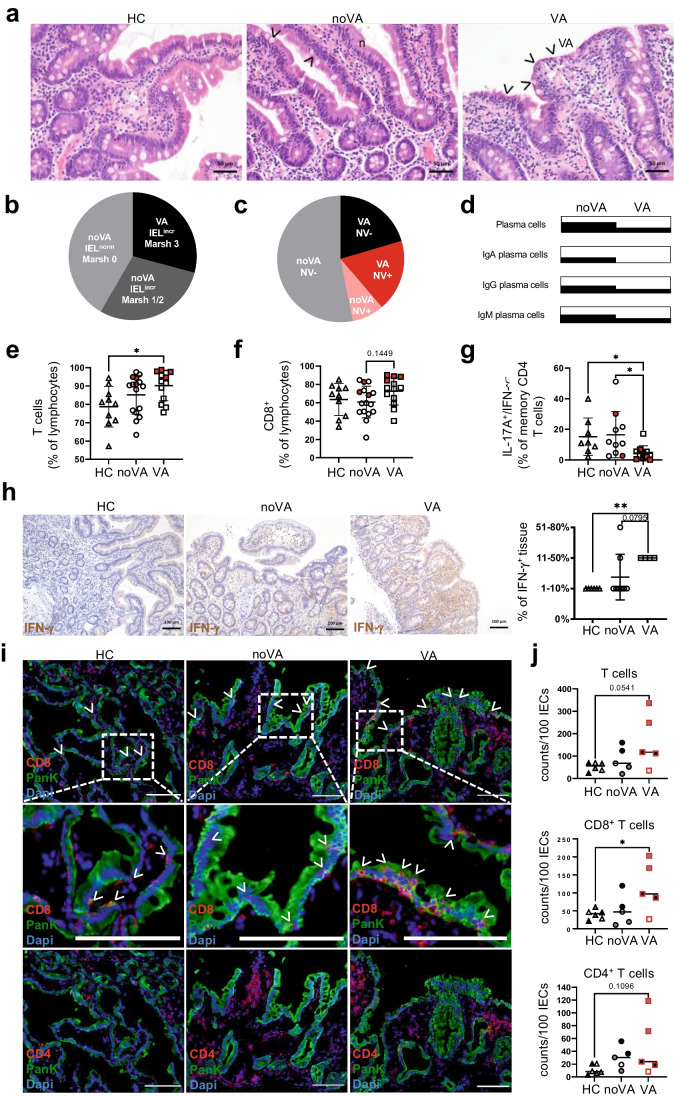
CVID villous atrophy tissues lack (IgA+) plasma cells, present with a disturbed T cell homeostasis and increased IFN-γ expression. a Representative histologies of duodenal biopsies of a healthy control (HC), a CVID patient without villous atrophy (noVA), and a CVID patient with villous atrophy (VA). Arrows denote intraepithelial lymphocytes (IELs). b Frequency of patients with increased IELs and VA, according to Marsh 3 (n = 21), of patients with increased IELs but absence of VA (noVA), according to Marsh 1–2 (n = 21), and patients without increased IELs and noVA, according to Marsh 0 (n = 30), within the studied cohort. c Frequency of norovirus (NV) infection among VA and noVA patients within the studied cohort. In pink, NV-positive noVA patients (n = 4); in red, NV-positive VA patients (n = 9); in gray, NV-negative noVA patients (n = 26); and in black, NV-negative VA patients (n = 10). d Frequency of the presence of total, IgA+, IgG+, and IgM+ plasma cells (PC) within tissues of VA (n = 21) and noVA (n = 43) patients, investigated by immunohistochemistry (IHC). e Proportion of CD3+ T cells of CD45+ lymphocytes within HC (n = 10), noVA (n = 16), and VA (n = 13) tissues. Patients with NV infection are highlighted in red. f Proportion of CD8+ T cells of CD45+ lymphocytes within HC (n = 10), noVA (n = 16), and VA (n = 13) tissues. Patients with NV infection are highlighted in red. g Proportion of IL17A+/IFN-γ− cells of memory CD4+ T cells, after the 4-h PMA + ionomycin stimulation, isolated from tissues of HCs (n = 8), noVA (n = 10), and VA (n = 11) patients. Patients with NV infection are highlighted in red. h Exemplary IHC staining for IFN-γ expression within tissues of a HC, a noVA patient, and a VA patient. Graph showing statistical analysis of the proportion of IFN-γ+ cells among the total tissue of HCs (n = 6) and noVA (n = 8) and VA (n = 4) patients. i Representative images of immunofluorescence (IF) staining performed by multi-epitope-ligand cartography (MELC) for CD8 (in red), CD4 (in red, bottom), pancytokeratin (Pank, in green), and 4′,6-diamidino-2-phenylindol (Dapi, in blue) within HC (n = 3), noVA (n = 3), and VA (n = 3) tissues. Arrowheads indicate CD8+ IELs. Dotted line marks selected field for higher magnification shown in second row. Scale bars show 100 µm. j Relative counts of total, CD4+, and CD8+ T cells per 100 intestinal epithelial cells (IECs) within HC (n = 3), noVA (n = 3), and VA (n = 3) tissues as quantified from MELC data (see the “Methods”). Two fields of view (FOVs) are depicted for each tissue specimen (except two patients). Color code indicates data of FOVs from the same tissue specimen within the group. In red, norovirus positive patients. P values as determined by one-way ANOVA with Tukey’s multiple comparison test (e, f, j) or Kruskal–Wallis test with Dunn’s multiple comparison test (g, h), depending if the samples were normally distributed or not, comparing the mean of each column with the mean of every other column. The linear relationship between Marsh score and single measurements was determined by simple linear regression, defining the coefficient of determination (R.2) (e–g)

