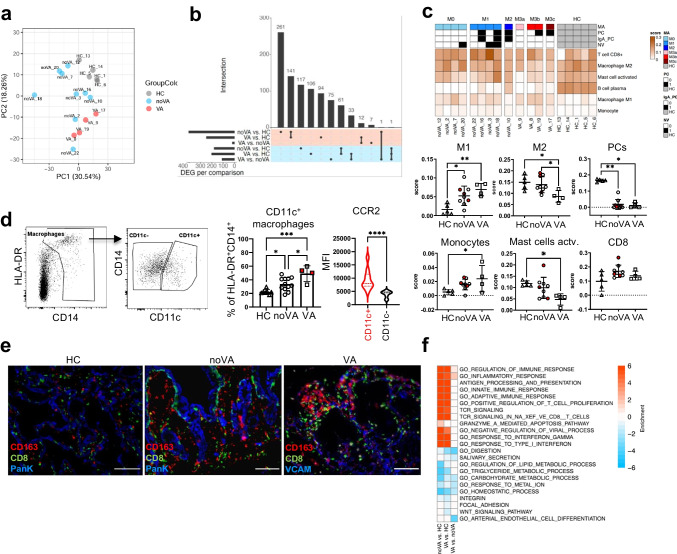
Fig. 3.
Transcriptome analysis of CVID enteropathy patients reveals immune activation and IFN-driven inflammation in VA and noVA tissues. a Principal component analysis (PCA) on RNA-seq data. PCA was performed on the top 10% most variable genes, based on the median absolute deviation (MAD) score calculated on the mRNA-normalized intensity (CPM). Color code indicates the different groups. b UpSet plot comparing the differentially expressed genes (adjusted P value < 0.05) in noVA vs. HC, VA vs. HC, and VA vs. noVA. Upregulated genes are highlighted with red and downregulated genes with blue background, respectively. c Cell type deconvolution heatmap showing the predicted immune cell distribution in each sample. Color code represents the cell fraction score. Legend depicts information on the Marsh score (M, M0–M3c), presence of total plasma cells (PC) or IgA+ PCs (IgA_PC), and presence of norovirus (NV) infection for each patient sample. Statistical analysis for cell fraction scores of M1 and M2 macrophages, PCs, monocytes, activated mast cells, and CD8+ T cells (CD8+) within HC (n = 5), noVA (n = 9), and VA (n = 4) tissues. Patients with NV infection are highlighted in red. d Gating strategy for tissue-homing CD11c+ and CD11c− macrophage subsets. Pre-gated on living CD45+ cells. Statistical analysis of the proportion of CD11c+ macrophages of the total HLA-DR+CD14+ macrophage subset, within HCs (n = 7), noVA (n = 12), and VA (n = 4) tissues. Patients with NV infection are highlighted in red. Mean fluorescence intensity (MFI) of CCR2 in CD11c+ (in red) and CD11c− (in black) macrophages, columns include patient (n = 8) and HC (n = 2) values. e IF staining performed by MELC for CD163 (macrophages, in red), CD8 (in green), and PanK/VCAM (in blue) in HC (n = 1), noVA (n = 1), and VA (n = 1) tissues. Scale bars show 100 µm. f Gene set enrichment heatmap. Relevant gene sets were selected among the top significant ones. Color code represent the enrichment score (i.e., − log10 P value for upregulated gene set, + log10 P value for downregulated gene sets). P values as determined by one-way ANOVA with Tukey’s multiple comparison test (c M1, M2, monocytes; d CD11c.+ macrophages) or Kruskal–Wallis test with Dunn’s multiple comparison test (c PCs, mast cells, CD8) depending if the samples were normally distributed or not, comparing the mean of each column with the mean of every other column and by Mann–Whitney test (d CCR2 mean)

