Fig. 4.
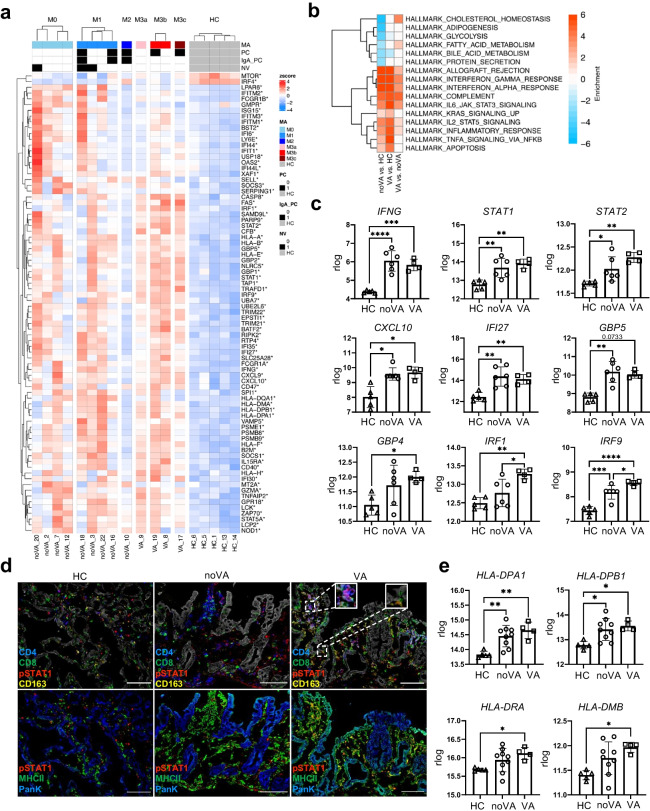
Strong induction of interferon signaling and interferon response genes (IRGs) in CVID VA and norovirus positive tissues. a Interferon heatmap showing strong upregulation of interferon signaling in CVID (n = 13) compared to HC (n = 5) tissues. Genes annotated with interferon type I, II, or III in MSigDB were pooled. Only significantly regulated genes are shown (adjusted P value < 0.05). Color code represents the Z-score mRNA intensity. Legend depicts information on the Marsh score (M, M0–M3c), presence of total plasma cells (PC) or IgA+ PCs (IgA_PC), and presence of norovirus (NV) infection for each patient. b Gene set enrichment heatmap showing the regulated terms in VA (n = 4) versus noVA (n = 6), excluding NV+ samples. Top 10 significant HALLMARK gene sets per comparison are shown. Color code represent the enrichment score (i.e., − log10 P value for upregulated gene set, + log10 P value for downregulated gene sets). c Regularized logarithmic (rlog) counts of IFNG and several IRGs from RNA-seq data of HC (n = 5), noVA (n = 6), and VA (n = 4) tissues, excluding NV+ samples. d Representative image of IF staining performed by MELC for pSTAT1 (in red), CD4 (in blue), CD8 or HLA-DR (MHCII) (in green), and CD163 (in yellow) within HC (n = 1), noVA (n = 1), and VA (n = 1) tissues. PanK is shown in white in the upper panel and in blue in the bottom. Dotted line marks selected fields for higher magnification. Scale bars show 100 µm. e Regularized logarithmic (rlog) counts of genes involved in the stabilization and formation of MHCII complexes, from RNA-seq samples of HCs (n = 5), noVA patients (n = 9), and VA patients (n = 4). P values as determined by one-way ANOVA with Tukey’s multiple comparison test (c IFNG, STAT1, STAT2, IFI27, GBP4, IRF1, IRF9; e HLA-DPA1, HLA-DPB1, HLA-DRA) or Kruskal–Wallis test with Dunn’s multiple comparison test (c CXCL10, GBP5; e HLA-DMB) depending if data were normally distributed or not, comparing the mean of each column with the mean of every other column

