Fig. 6.
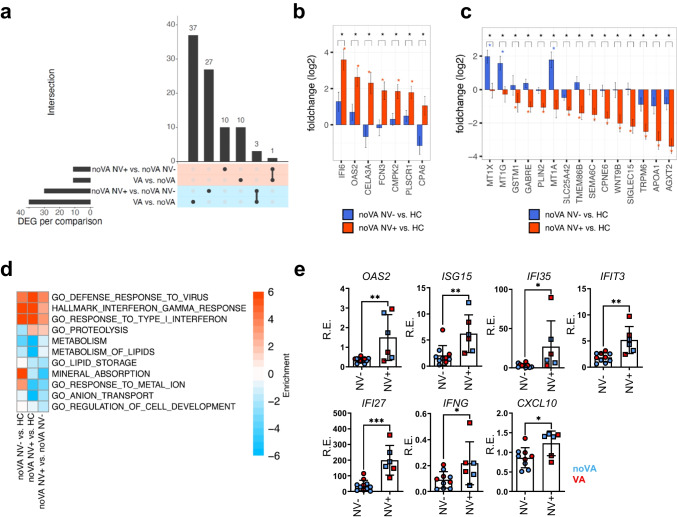
NV infection exacerbates the mixed IFN type I/III and II signature in CVID enteropathy and contributes to the impairment of homeostatic tissue functions. a UpSet plot comparing the differentially expressed genes (adjusted P value < 0.05) in noVA NV+ (n = 3) vs. noVA NV− (n = 3) tissues and in VA (n = 4) vs. noVA (n = 6) tissues. Upregulated and downregulated genes are highlighted with red and blue background, respectively. b Gene-level log2 fold change bar plots for differentially upregulated genes in noVA NV+ (n = 3, in red) vs. noVA NV− (n = 6, in blue) samples. c Gene-level log2 fold change bar plots for differentially downregulated genes in noVA NV+ (n = 3, in red) vs. noVA NV− (n = 6, in blue) samples. d Gene set enrichment heatmap showing the regulated terms in noVA NV+ (n = 3) vs. noVA NV− (n = 6) tissues. Relevant gene sets were selected among the top significant ones. Color code represent the enrichment score (i.e., − log10 P value for upregulated gene set, + log10 P value for downregulated gene sets). e Relative expression (RE) of the antiviral response genes OAS2, ISG15, IFI35, and IFIT3 among other IRGs, analyzed by RT-qPCR. Expression was analyzed within NV+ (n = 6) and NV− (n = 9–11) tissues, excluding tissues of patients with monogenetic defects. Color code indicates noVA (in blue) and VA (in red) tissues. P values as determined by unpaired t test (e OAS2, IFIT3, IFI27) or Mann–Whitney test (e ISG15, IFI35, IFNG, CXCL10) depending if data were normally distributed or not

