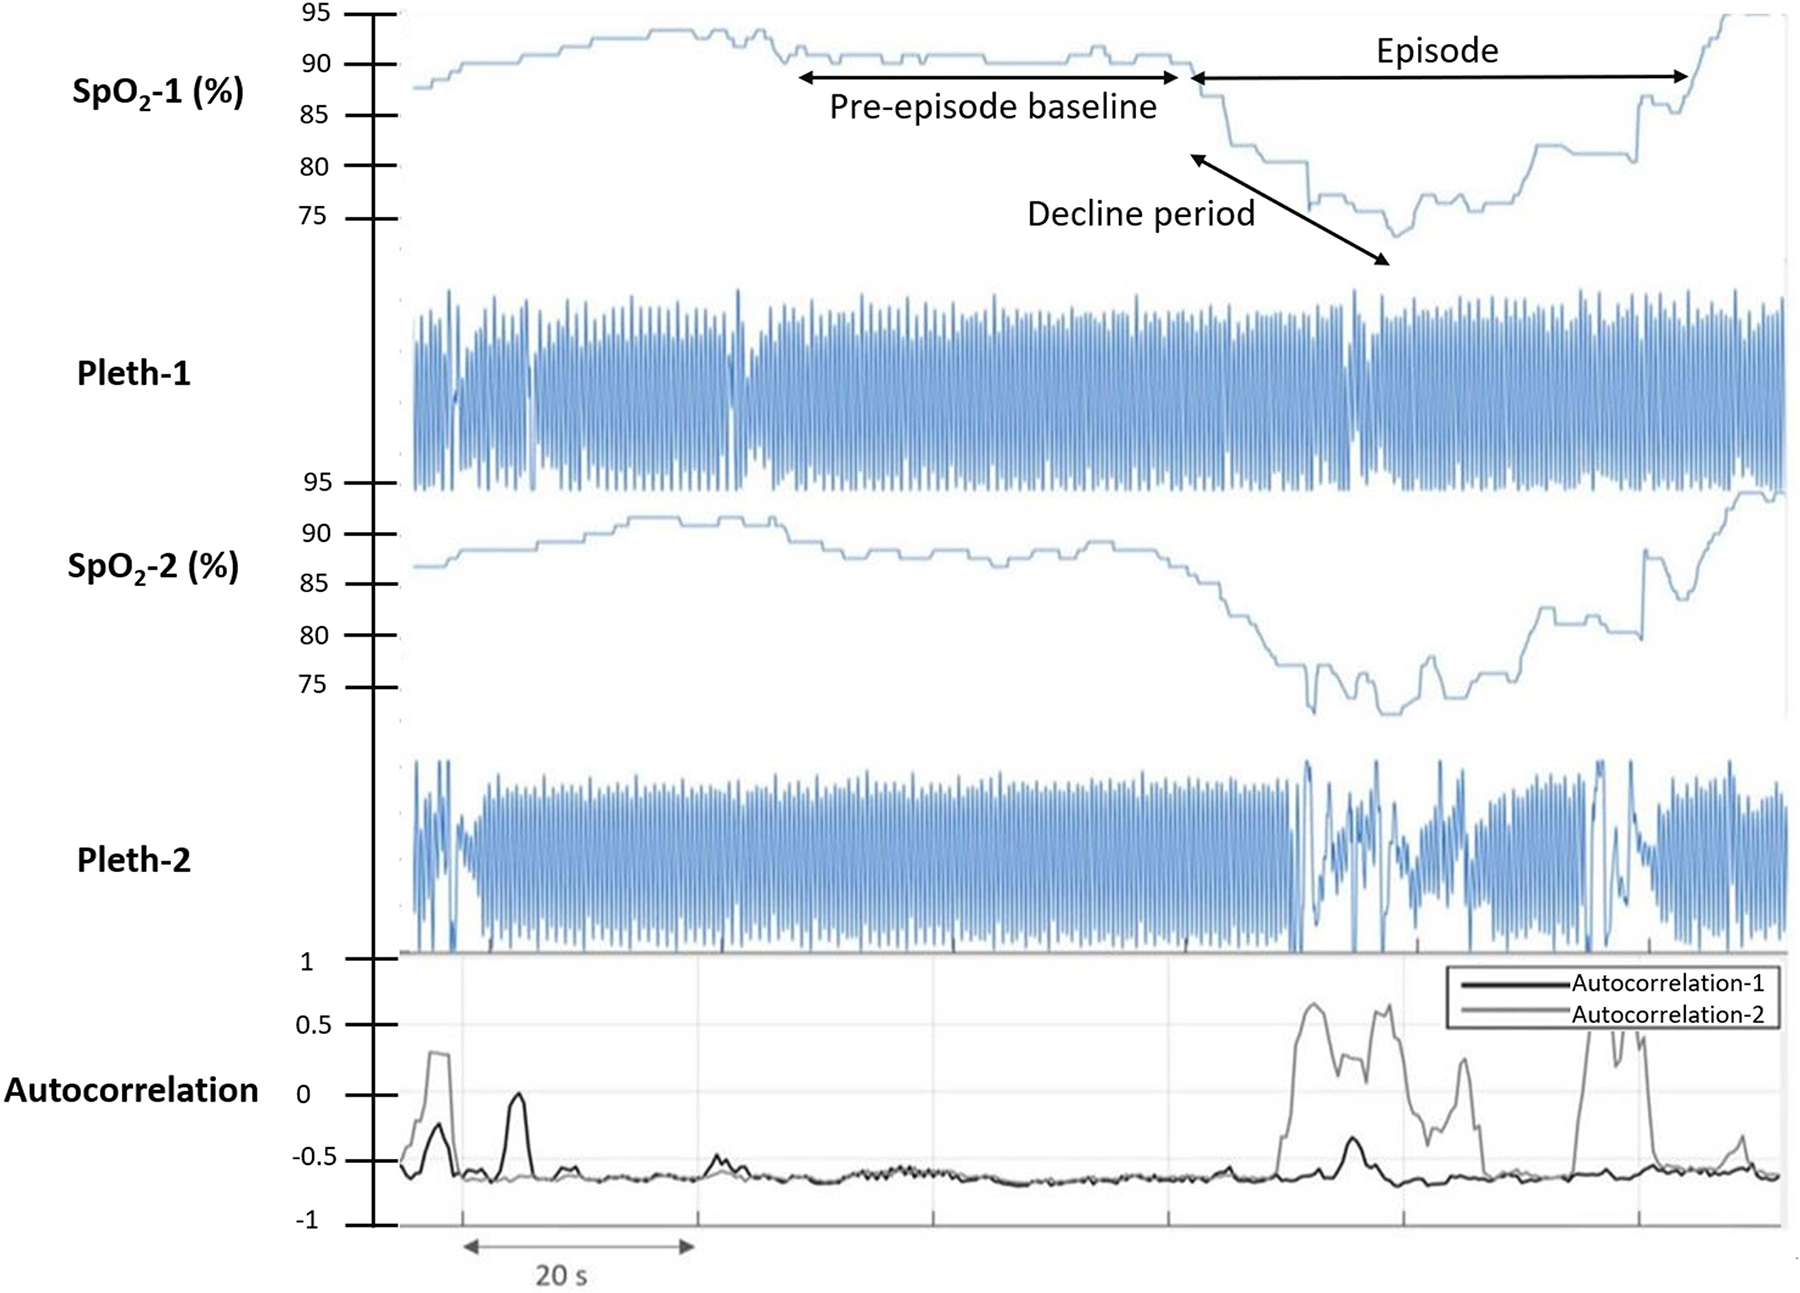
Figure 1. Hypoxemia Episode Type A (true hypoxemia).

The figure shows a simultaneous decline in both SpO2 signals. Only one Pleth waveform is affected by motion artifact as indicated in by an increase in autocorrelation index above baseline (lower panel, grey) while the other Pleth does not show motion and the autocorrelation index remain at baseline (lower panel, black). The arrows indicate the pre-episode baseline, declining SpO2 and the episode segments that were examined for the presence of motion artifact.
