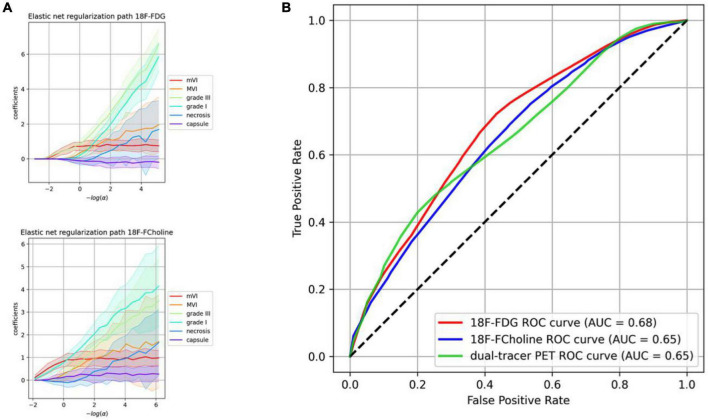
FIGURE 6.
Regularization paths and model performances including the most relevant histological parameters finally retained. (A) Regularization paths for 18F-fluorodeoxyglucose (18F-FDG) and 18F-choline. The more the penalization decreases (right side), the more the coefficients are scattered. (B) Receiver operating characteristic (ROC) curves of the dimensionality-reduced models’ performance. The ROC curve illustrates the capacity of classifiers to discriminate positive and negative cases at different thresholds (e.g., for the 18F-FDG model and a desired 60% positive rate, the algorithm will yield 38% of false alarms). The random model is represented by identity (dotted line), and the perfect model (with no randomness) is y = 1 on [0, 1].

