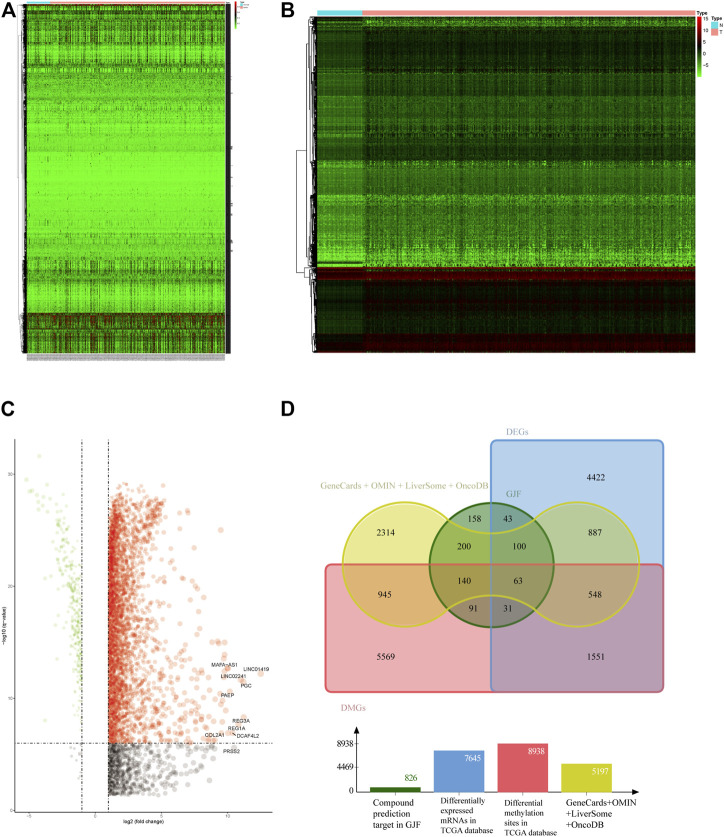
FIGURE 2.
(A) Heatmap of HCC-associated differential methylation sites in the TCGA database (B) Heatmap of HCC-related differentially expressed genes in the TCGA database (C) Volcano plot of HCC-related differentially expressed genes in the TCGA (D) Venn diagram of the intersection of HCC-related targets (DEGs, differentially expressed genes; DMGs, differentially methylated genes).

