Figure 2.
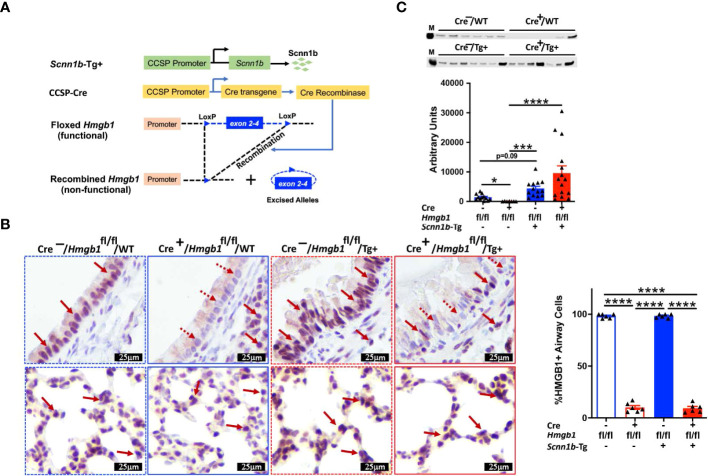
Airway epithelial cell-specific deletion of HMGB1. (A) Schematic diagram of transgenes used in the generation of airway epithelial cell-specific HMGB1-deficient mice. Airway epithelial cell-specific HMGB1-deficient Scnn1b-Tg+ (CCSP-Cre+/Hmgb1fl/fl/Tg+) mice were generated by crossing club cell-specific Cre recombinase (CCSP-Cre+), floxed Hmgb1 (Hmgb1fl/fl), and Scnn1b-Tg+ mice. (B) Immunohistochemistry for HMGB1 in lung sections from airway epithelial cell-specific HMGB1-sufficient and airway epithelial cell-specific HMGB1-deficient WT and Tg+ mice. Red solid arrow indicates the HMGB1-stained cells. Red dotted arrow indicates the cells negatively stained for HMGB1. Bar graph shows percent HMGB1-stained cells in the airways. Sample size n=6/group; Error bars represent Mean ± SEM. One-way ANOVA followed by Tukey’s post hoc test was used for the statistical analysis. ****p < 0.0001. (C) Western blot showing the depletion of HMGB1 in Cre+/Hmgb1fl/fl/WT (Cre+/WT) juveniles (red open bar), while comparable HMGB1 between Cre-Hmgb1fl/fl/Tg+ (Cre-/Tg+) (blue solid bar) and Cre+/Hmgb1fl/fl/Tg+ (Cre+/WT) (red solid bar) juveniles. Equal volumes of cell-free BALF from all the groups were used as loading samples. M, band from size ladder. Sample size n=7-15/group. Error bars represent Mean ± SEM. One-way ANOVA followed by Tukey’s post hoc test was used for the statistical analysis. *p < 0.05, ***p < 0.001, ****p < 0.0001.

